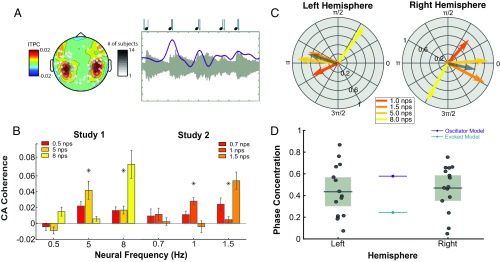
Fig. 4.
Phase lag to various note rates. (A, Left) The topography of ITPC as analyzed in a previous paper (reprinted from ref. 4). Sensors shown are those selected based on response to single tones. Grayscale represents the number of participants for which that channel was picked. (A, Right) An example from single subject averaged over 20 trials of high synchrony. Note how the peak of the neural response (violet) is well aligned to the onset of acoustics (light gray). Markers for peak and onset are presented above. (B) CACoh analysis shows significant synchrony at frequencies from 1 to 8 Hz. Colors refer to note rate of each stimulus condition. They are analyzed separately by study. Asterisks denote significant main effects of note rate at the specific neural frequency in a one-way ANOVA. (C) Phase lag in left and right hemispheres on the unit circle for the four note rates that showed successful synchrony. PCV is plotted in dark gray. (D) Phase concentration for both hemispheres. Box plots show mean and CI of the MEG data (participant data in gray dots). The oscillator and evoked model predictions are represented by lines in violet and teal, respectively.

