Fig. 5.
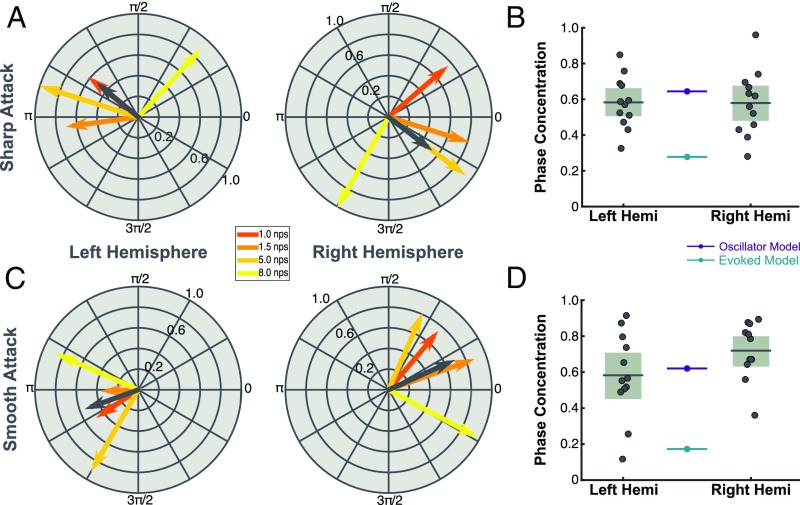
Smooth attacks place MEG data in line with oscillator model. (A) Phase lag for the four note rates that showed significance in the previous study in response to new stimuli with sharp attack. The phase concentration angle is shown in dark gray. (B). PCM for models and data with the new stimulus input. Box plots (light gray) show 95% CIs and mean (dark gray line) of the sample data (gray dots). Colored lines (teal and violet) reflect predictions of the models (evoked and oscillator, respectively). (C and D) A plot of phase synchrony and phase concentration in response to new stimuli with smoothed attacks.

