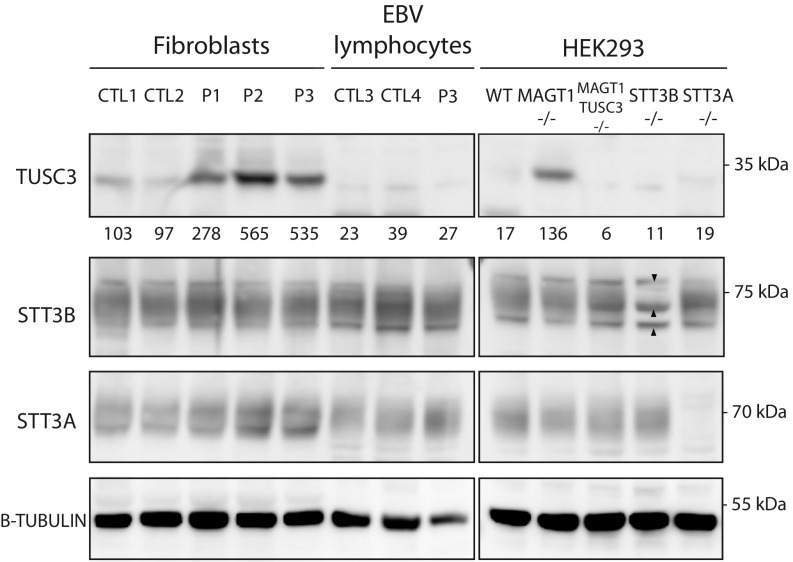
Fig. 2.
Stability of different OST subunits. Fibroblasts, EBV-transformed lymphocytes, and HEK293 cells were analyzed for protein steady state levels of TUSC3, STT3B, and STT3A. The arrowheads depict the nonspecific bands comigrating with STT3B. β-Tubulin was used as a loading control. Values below the TUSC3 blot represent averaged values normalized to the average of the control fibroblast cells (n = 3).

