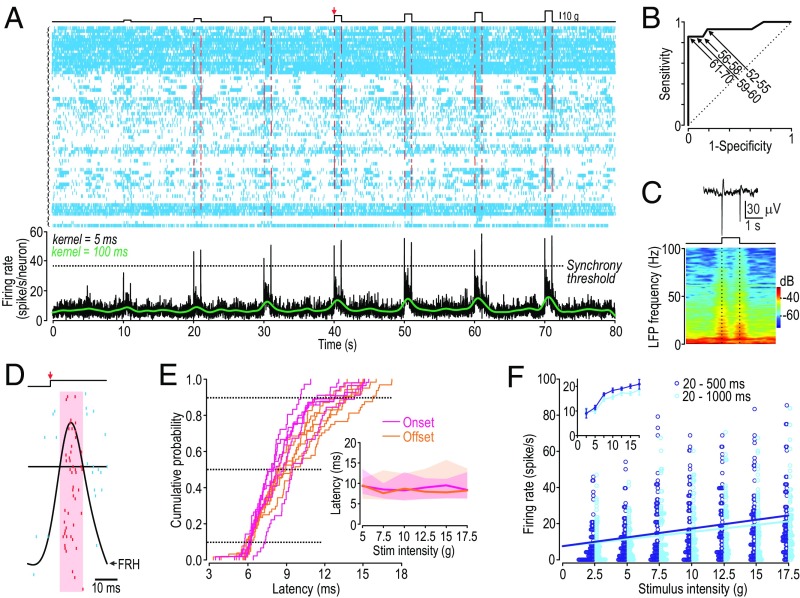
Fig. 1.
Neurons in primary somatosensory (S1) cortex use spike timing and rate to encode different tactile stimulus features. (A) Rasters from 17 neurons, four trials each, during tactile simulation (Top). FRH was calculated using a narrow (σ = 5 ms; black) or broad (σ = 100 ms; green) Gaussian kernel. Black FRH was thresholded to distinguish synchronous (red) from asynchronous (blue) spikes. Arrow highlights 10 g stimulus. (B) Receiver operating characteristic curve shows sensitivity and specificity with which synchronized spiking can predict stimulus onset or offset, depending on threshold value. Numbers on graph show threshold as percentage of maximum possible firing rate. Synchrony threshold = 65% for A and D, which means the onset and offset of the weakest stimulus (2.5 g) was not detected. If only stimuli ≤10 g are considered, 100% sensitivity and 86% specificity can be achieved by lowering the threshold. (C) Local field potential (LFP) averaged across five responses to 10 g stimulation (Top) and the corresponding spectrogram (Bottom). (D) Horizontally expanded rasters at onset of 10 g stimulus. Spikes during interval when FRH exceeds synchrony threshold (red shading) are considered synchronous. Some cells produce a quick burst of two to four spikes, but most contribute a single spike per volley. All true positive synchronized volleys (i.e., those that correctly identify stimulus onset or offset) are complete within 20 ms. (E) Cumulative probability distribution of synchronous spike latency from stimulus onset (pink) or offset (orange). Each curve represents a different stimulus intensity. (Inset) Median latency (lines) and 10–90 percentile range (shading) do not vary systematically with stimulus intensity. (F) Modulation of sustained firing rate. Excluding the first 20 ms, during which synchronous spikes occur; firing rate was calculated over the first half (20–500 ms, blue) or full duration (20–1,000 ms, cyan) of each stimulus step to gauge the effects of adaptation. Regression line slopes differed significantly from horizontal (P < 0.0001, one-sample t tests). (Inset) Average rate of 17 neurons averaged across trials to give mean ± SEM. Firing rate was significantly affected by stimulus intensity (F6,42 = 21.42; P < 0.001, two-way ANOVA) and adaptation (F1,42 = 7.22; P = 0.01); firing rate evoked by 2.5 or 5 g was consistently less than that evoked by ≥7.5 g (P < 0.05, Student-Neuman-Keuls post hoc tests).

