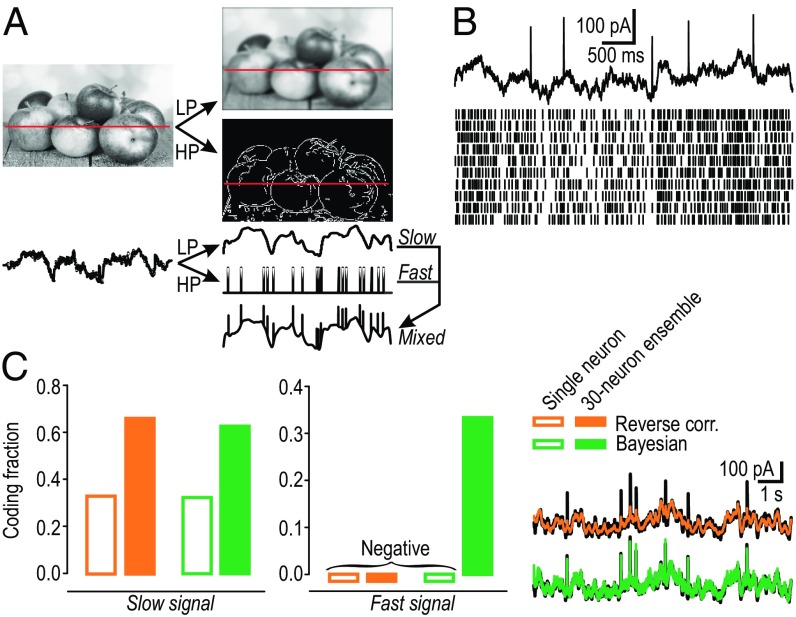
Fig. 2.
Slow and fast signals can be demultiplexed from responses to mixed signal. (A) Basis for mixed signal. (A, Top) Decomposition of image by sensory neurons behaving as low-pass (LP) or high-pass (HP) filters. (A, Bottom) Gray-scale intensity along cut through LP image corresponds to slow signal representing luminance, a first-order stimulus feature. Same cut through HP image yields a series of discrete events representing edges and other areas of high contrast, a second-order stimulus feature. Convergence of those signals creates a “mixed” signal. See also SI Appendix, Fig. S2. (B) Sample rasters from 10 model neurons (Bottom) receiving a common mixed signal (Top) and independent noise (not illustrated). Spiking evoked by the fast component is not obviously different from spiking evoked by the slow component. (C) Decoding of the mixed signal using standard reverse correlation (orange) or a Bayesian decoding method (green) applied to the response of a single neuron (open bars) or a 30-neuron ensemble (filled bars). (Inset) Original mixed signal (black) overlaid with signal reconstructed from the ensemble response (color; Methods and SI Appendix, Fig. S3). Signal reconstruction was quantified as coding fraction, , where CF = 1 represents perfect reconstruction and CF ≤ 0 represents failure to explain any variance.

