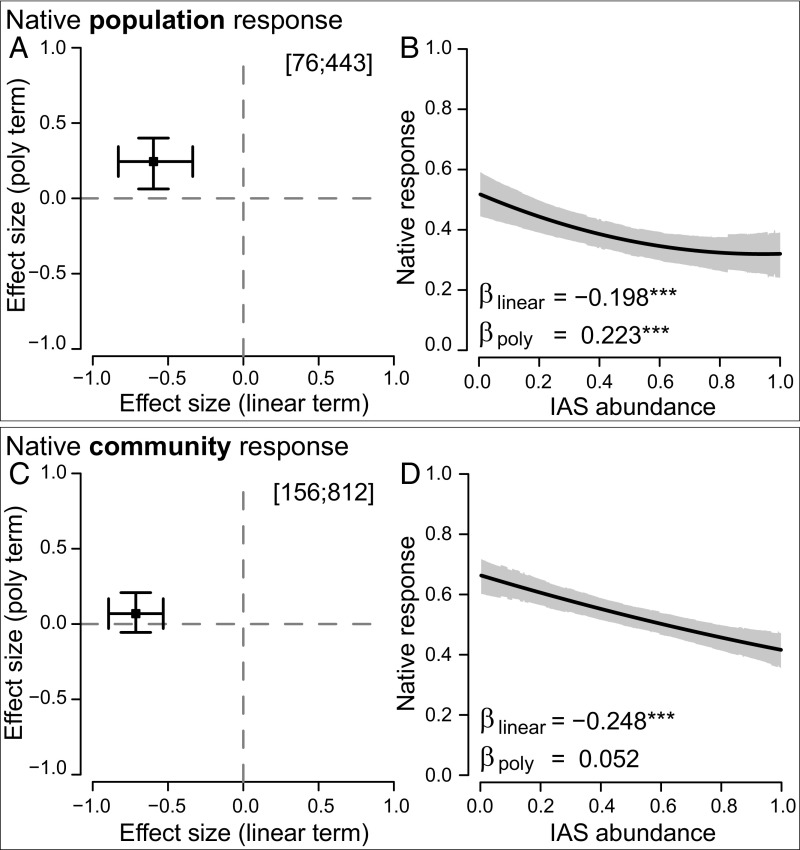
Fig. 2.
The shape of native species’ responses is nonlinear at the population level but linear at the community level. (A and C) Analyses based on partial-r. (B and D) The slope analyses. Numbers in brackets are total papers and studies analyzed. Effect size estimates in A and C are statistically supported when 95% credible interval bars do not cross the zero lines. Slope plots show model predictions (black line) with gray shading indicating the 95% credible zone. Significant linear (βlinear) or polynomial (βpoly) regression terms are indicated by asterisks (***P < 0.001).

