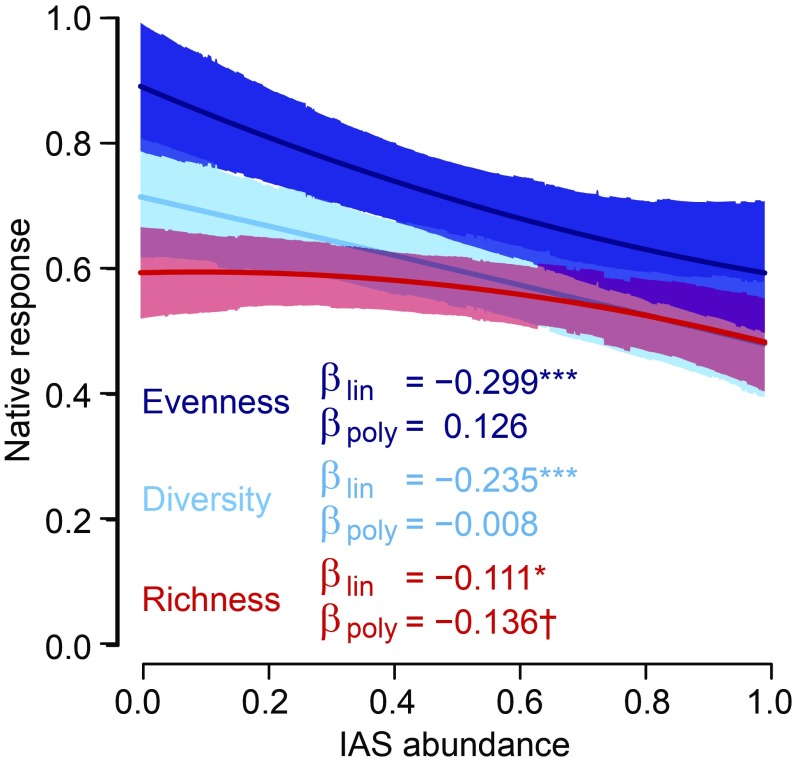
Fig. 4.
IAS have significant negative linear effects on native community-level richness (red), diversity (cyan), and evenness (blue). There were significant differences between community-level responses for both linear and polynomial terms, which are reported in the results. Lines show model predictions, with shading indicating the 95% credible zone. Significant linear (βlin) or polynomial (βpoly) regression terms are indicated as follows:†P < 0.10; *P < 0.05; ***P < 0.001.

