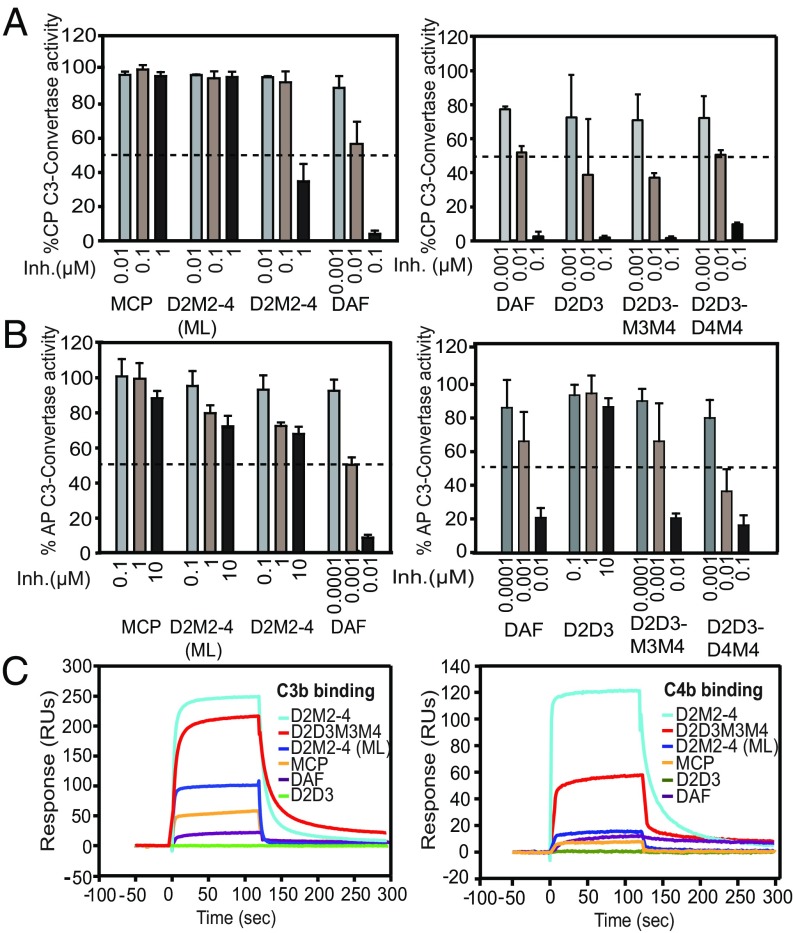
Fig. 2.
Decay-accelerating activity and binding analysis of DAF-MCP chimeras. (A) CP-DAA and (B) AP-DAA of DAF, MCP, D2D3 mutant, and the indicated DAF-MCP chimeras. “Inh.” denotes inhibitor concentration. Data shown are mean ± SD of three independent experiments summarized in SI Appendix, Table S1. The dashed line denotes 50% activity. (C) Binding analysis of DAF, MCP, D2D3 mutant, and the DAF-MCP chimeras to C3b (Left) and C4b (Right). The graph represents the sensogram overlays of binding interactions shown as response units on the y axis. Binding was measured by flowing 1 µM of the respective proteins over the C3b- (Flow cell-2) and C4b-biotin (Flow cell-3) immobilized on a streptavidin chip. Data shown here are from one of the three independent experiments shown in SI Appendix, Fig. S1.

