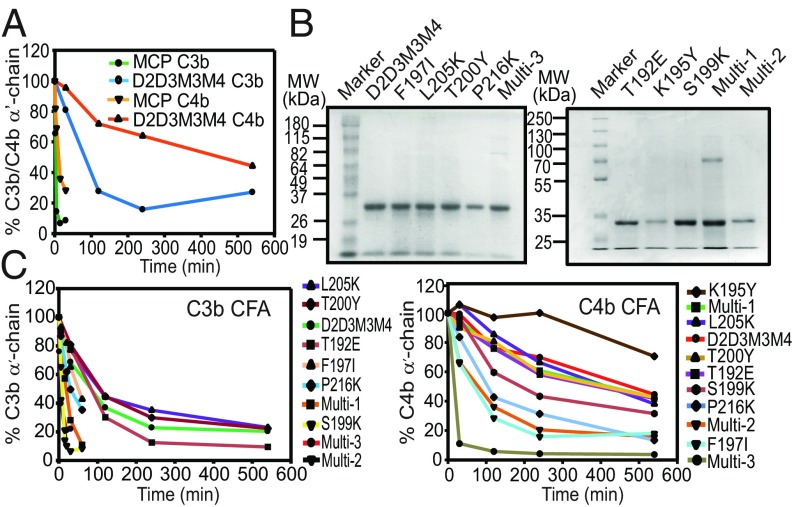
Fig. 3.
Cofactor activity of D2D3M3M4 and its substitution mutants. (A) Relative C3b-CFA and C4b-CFA of MCP and D2D3M3M4. Data shown are mean of three independent experiments summarized in SI Appendix, Table S1. (B) SDS/PAGE analysis of D2D3M3M4 and its single and multiresidue mutants expressed in E. coli. (C) Relative C3b-CFA and C4b-CFA of D2D3M3M4 and its single and multiresidue mutants. The order of the symbol key from top to bottom corresponds to the order of the lines (i.e., least to most active). Data shown in the graphs are mean of three independent experiments summarized in SI Appendix, Table S1.

