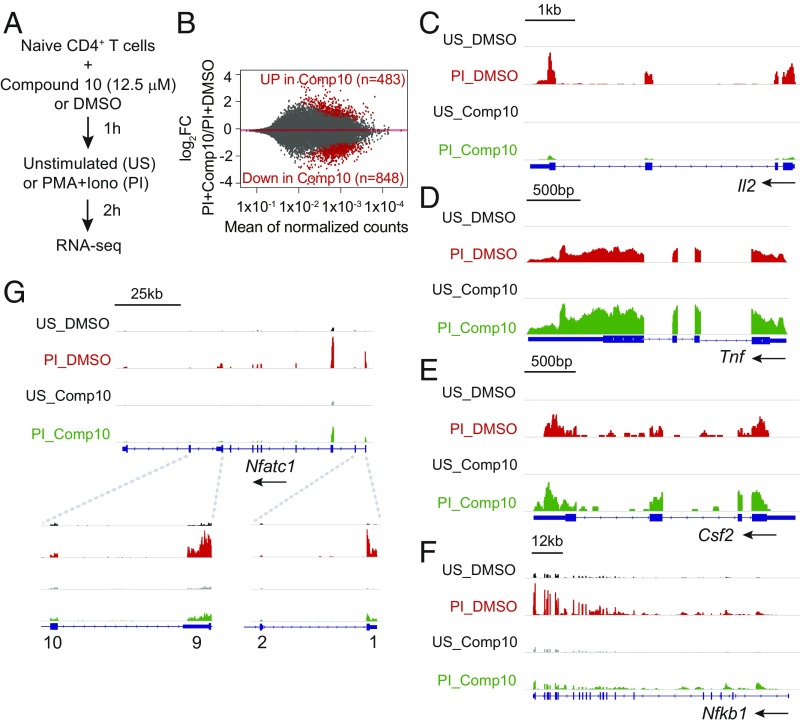
Fig. 6.
Transcription profile regulated by Compound 10 in naïve CD4+ T cells. (A) Schematic representation of the RNA-seq assay. Sorted naïve CD4+ T cells were preincubated with Compound 10 or DMSO for 1 h, then left unstimulated (US) or stimulated with PMA (10 nM) and ionomycin (500 nM) (PI) for 2 h. (B) MA plots indicating the number of genes up-regulated (483) or down-regulated (848) by Compound 10 in stimulated naïve CD4+ T cells (PI+Compound 10) versus DMSO control (PI+DMSO). The y axis indicates the log2FC in expression of individual mRNAs in the PI+Compound 10 condition compared with the PI+DMSO condition. Genes scored as significantly up-regulated or down-regulated, with FDR threshold = 0.05, are represented by red symbols. (C–G) Genome browser views of RNA-seq signal at the Il2, Tnf, Csf2, Nfkb1, and Nfatc1 loci in unstimulated (US) and stimulated (PI) conditions, in the absence (DMSO) or in the presence (Comp10) of Compound 10, as indicated. Blue boxes correspond to exons, and arrows indicate the direction of transcription.

