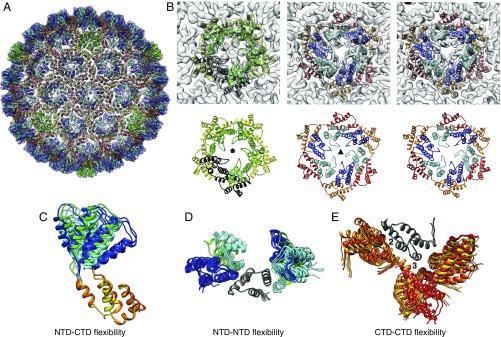
Fig. 5.
Variability of Ty3 CA-NTD and CA-CTD relative orientations. (A) Model of a complete Ty3 PR- particle showing fitted protein models and EM density (transparent gray). Proteins are colored as in Fig. 3. (B) Close-up views of the different positions within the Ty3 particle. One monomer in a fivefold position is highlighted in black for clarity. (C) Superimposition of the nine independent copies of CA showing the large relative movements of the CA-NTD and CA-CTD about the flexible interdomain linker. The CA-CTD was used for alignment of the structures. (D) Superimposition of the nine independent copies of CA-NTD, together with their neighbors, showing three distinct relative orientations aligned on one CA-CTD (gray). (E) Superimposition of the nine independent copies of CA-CTD, together with their neighbors, aligned on one CA-CTD (gray), illustrating continuous variability of the dimer and trimer CA CTD–CTD interfaces.

