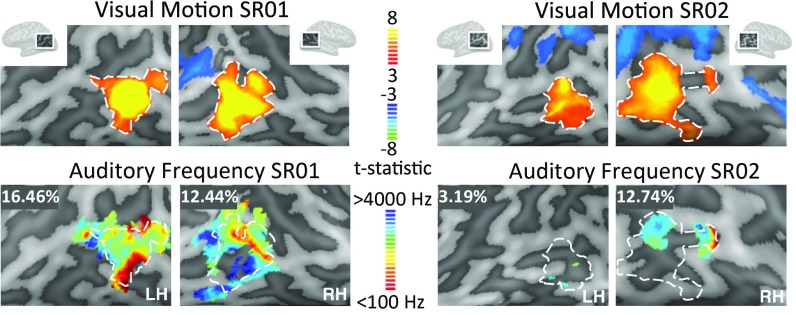
Fig. 3.
(Upper) BOLD responses to the visual motion localizer in SR01 and SR02 (false discovery rate adjusted P < 0.05). (Lower) Best-frequency maps plotted on the cortical surface in SR01 and SR02 estimated using the auditory moving stimulus. Functionally defined hMT+ is shown with a white dashed outline. For visualization, pRF estimates were based on the full set of runs, with a threshold of r > 0.2 (not cross-validated). The percentage of voxels showing frequency tuning (defined as having a cross-validated correlation threshold above r > 0.2) within this functionally defined hMT+ ROI are reported in the Upper Left of each frequency-tuning map. Each Inset spans ∼9 cm. LH, left hemisphere; RH, right hemisphere.

