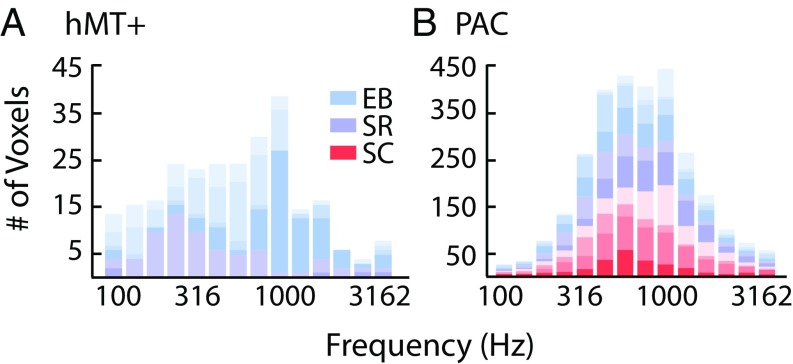
Fig. 4.
(A) The distribution of auditory frequency tuning within hMT+ ROIs in early-blind (EB; blue) and sight-recovery (SR; purple) subjects. Because no voxels passed a cross-validated threshold of r > 0.20 in the sighted group, no sighted controls (SC; red) are plotted. (B) The distribution of auditory frequency tuning within PAC ROIs in early-blind (blue), sight-recovery (purple), and sighted controls (red).

