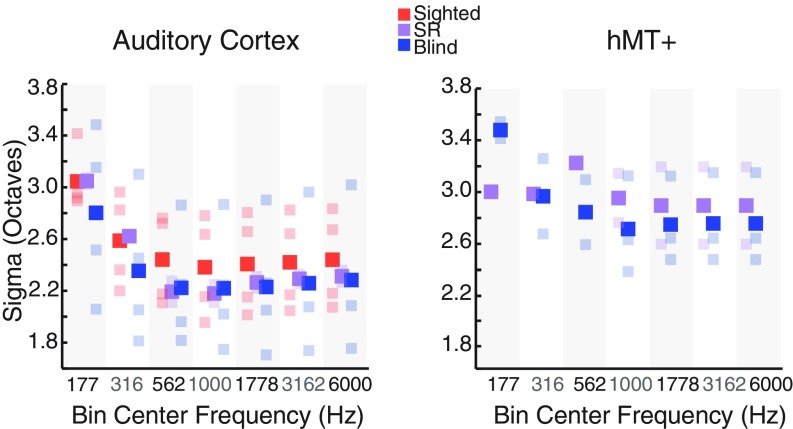
Fig. 6.
PRF tuning width as a function of frequency. Voxels were sorted into half-octave bins based on their best-frequency values. Best frequency and tuning widths were estimated using the full set of runs, and voxels above a threshold of 0.2 (not cross-validated) were included. Mean tuning width was calculated for each bin, separately for the auditory cortex (Left) and hMT+ (Right) ROIs. Sighted, early-blind, and sight-recovery (SR) subjects are plotted in red, blue, and purple, respectively. Group means are plotted in saturated colors; individual subject means are plotted in corresponding desaturated colors.

