Fig. 1.
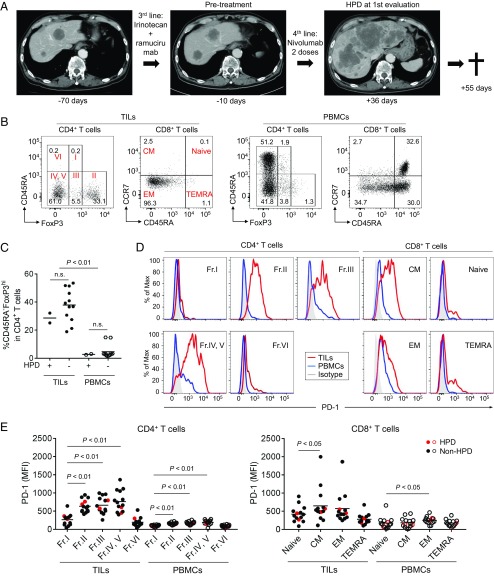
Clinical course of an HPD patient and PD-1 expression by various T cell fractions in tumors and the periphery. (A) Clinical course of an HPD patient. A 73-y-old male with an MDM2 amplification (case 3 in SI Appendix, Table S2) received anti–PD-1 mAb (nivolumab) as fourth-line treatment. After two doses of anti–PD-1 mAb, his performance status became poor, and the computed tomography showed rapid disease progression diagnosed as HPD. Fifty-five days after the initial administration of anti–PD-1 mAb, he died of tumor progression. (B) TILs and PBMCs collected from 14 GC patients before anti–PD-1 mAb treatment were subjected to flow cytometry. Representative flow cytometry plots of CD4+ T cells (CD45RA and FoxP3) and CD8+ T cells (CCR7 and CD45RA) are shown. (C) Frequency of CD45RA−FoxP3highCD4+ eTreg cells in 14 GC patients. (D and E) PD-1 expression by each CD4+ and CD8+ T cell fraction. TILs and PBMCs collected from 14 GC patients before anti–PD-1 mAb treatment were subjected to flow cytometry. Representative flow cytometry staining for PD-1 by each CD4+ and CD8+ T cell fraction. Red, TILs; blue, PBMCs; gray, isotype control (D). Summary of PD-1 expression by each CD4+ and CD8+ T cell fraction in 14 GC patients (E). Red circle, HPD patients; black circle, non-HPD patients; naive (CCR7+CD45RA+); CM, central memory (CCR7+CD45RA−); EM, effector memory (CCR7−CD45RA−); TEMRA, terminally differentiated effector memory (CCR7−CD45RA+).

