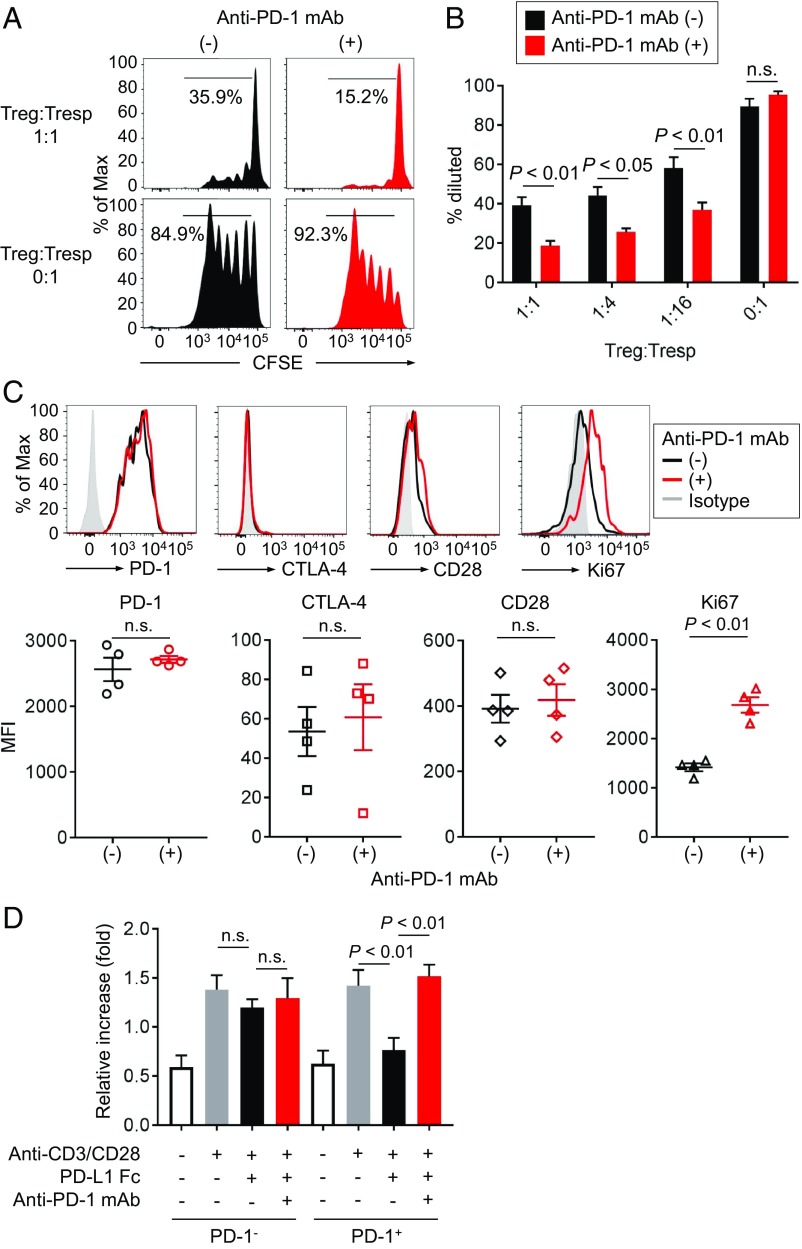
Fig. 4.
Role of PD-1 in Treg cell-mediated immune suppression. (A and B) PD-1+CD45RA−CD25highCD4+ T cells (eTreg cells) were sorted from PBMCs, and CFSE-labeled CD8+ T cells (Tresp cells) from PBMCs were cocultured with the indicated ratio of the sorted PD-1+ eTreg cells for 5 d with anti-CD3 mAb and irradiated APCs. Proliferation of Tresp cells was determined by CFSE dilution. Representative CFSE staining (A) and percent of proliferating Tresp cells in the cultures with the indicated ratio of Treg cells and Tresp cells (B). (C) eTreg cells in the cultures were subjected to flow cytometry to examine activation and proliferative status. (Top) Phenotypic changes (PD-1, CTLA-4, and CD28 expression) and proliferative capacity (Ki-67 expression) of eTreg cells with/without anti–PD-1 mAb (nivolumab). Black, anti–PD-1 mAb (−); red, anti–PD-1 mAb (+); gray, isotype control. (Bottom) Summary for expression levels detected by MFI of PD-1, CTLA-4, CD28, and Ki-67 of eTreg cells with/without anti–PD-1 mAb in four healthy individuals. (D) Proliferation of Treg cells. PD-1− or PD-1+ eTreg cells were sorted from PBMCs of healthy individuals and cultured with/without PD-L1 Fc Ig and/or anti–PD-1 mAb in the presence of anti-CD3 mAb and anti-CD28 mAb. Forty-eight hours after incubation, the proliferation of PD-1− or PD-1+ eTreg cells was evaluated by WST-1 assay. Ratio of the absorbance at 48 to 0 h is shown.

