Fig. 5.
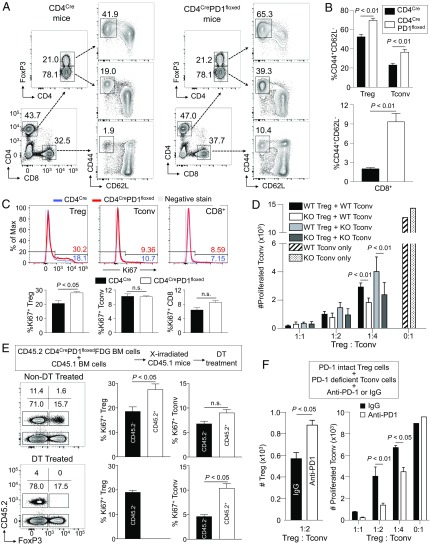
Strong proliferation and immunosuppressive function of murine Treg cells with PD-1 deficiency. (A–C) Spleen cells from 9- to 10-wk-old CD4CreFDG and CD4CrePD1floxedFDG mice were subjected to flow cytometry. Representative flow cytometry plots of activated CD44+CD62L− cells in FoxP3+CD4+ Treg cells, FoxP3−CD4+ Tconv cells, and CD8+ T cells in the indicated mice are shown (A). Summary for the percentage of activated (CD44+CD62L−) cells in each cell population (B). Representative staining (Top) and summary (Bottom) of proliferating (Ki67+) Treg cells, Tconv cells, and CD8+ T cells (C). n = 4 per each group. Blue, CD4CreFDG mouse; red, CD4CrePD1floxedFDG mouse; gray, negative stain control. (D) PD-1–intact (wild-type; WT) and PD-1–deficient (knockout; KO) Treg and Tconv cells were collected from CD4CreFDG and CD4CrePD1floxedFDG mice, respectively. PD-1–intact and PD-1–deficient Tconv cells were stained with CellTrace violet (CTV) and cocultured with either PD-1–intact or PD-1–deficient Treg cells at the indicated ratios of Treg cells and Tresp cells. After 3 d culture, the number of proliferating cells was measured by CTV dilution. (E) Bone marrow chimeric (BMC) mice were generated by transferring bone marrow (BM) cells comprising 70% CD45.1 and 30% CD45.2 CD4CrePD1floxed FDG into lethally irradiated recipient CD45.1 mice. DT was administered in BMC mice to deplete PD-1–deficient CD45.2+ Treg cells. Five days after DT treatment, spleen cells were collected and subjected to flow cytometry. Representative staining of CD4+ T cells in spleens (Left) and percentages of proliferating (Ki67+) Treg cells and Tconv cells (Right). n = 4–5 in each group. (F) PD-1–intact Treg cells were cocultured with PD-1–deficient Tconv cells labeled with CTV in the presence of either anti–PD-1 or isotype-matched IgG mAb. The number of FoxP3+CD4+ Treg cells recovered (Left) and the number of proliferating Tconv cells (Right) are shown. Numbers on flow cytometry plots indicate percentages of gated populations. Data are representative of at least two independent experiments.

