Fig. 6.
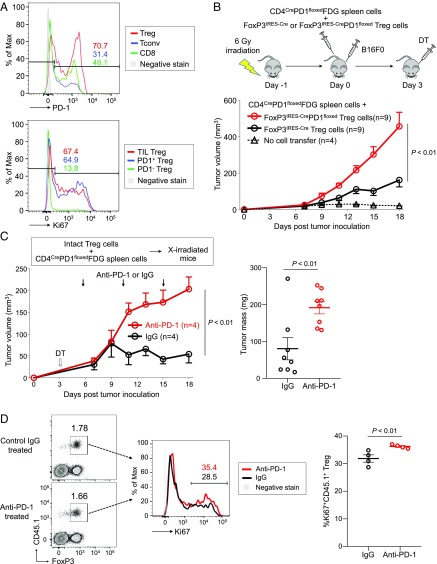
Increased tumor growth by PD-1–deficient Treg cells. (A) C57BL/6 mice were inoculated with B16F0 melanoma cells in the right rear flank. Fifteen days after inoculation, T cells were prepared from tumors and draining inguinal lymph nodes and subjected to flow cytometry. Representative flow cytometry staining for PD-1 expressed by Treg cells (red), Tconv cells (blue), and CD8+ T cells (green) in TILs (Top) and Ki67 expressed by TIL Treg cells (red) from tumor and PD-1+ Treg cells (blue) and PD-1− Treg cells (green) from draining lymph nodes (Bottom). (B) C57BL/6 mice were lympho-depleted by 6-Gy irradiation and then were transferred with spleen cells from CD4CrePD1floxedFDG mice and Treg cells from either FoxP3IRES-Cre or FoxP3IRES-CrePD1floxed mice. After cell transfer, mice were injected s.c. with B16F0 cells. DT was administered intraperitoneally 3 d after cell transfer to deplete Treg cells from the CD4CrePD1floxedFDG transferred fraction. Tumor growth of B16 tumors was measured over 18 d. (C) Irradiated (6 Gy) CD45.2 B6 mice were transferred with CD45.2 CD4CrePD1floxedFDG spleen cells and PD-1–intact CD45.1 Treg cells. Mice were injected with B16 tumor cells and DT as in B, and anti–PD-1 or isotype-matched IgG mAb was administered on days 5, 10, and 15. Tumor growth of B16 tumors was measured over 18 d (Left). Tumor masses measured on day 18 are shown (Right). (D) Tumor-draining lymph nodes in anti–PD-1 mAb-treated or control mice were collected on day 18 posttransfer to assess transferred CD45.1+ Treg cells. Representative flow cytometry staining (Left) and percentage (Right) of proliferating (Ki67+) transferred CD45.1+ Treg cells from both groups. Data are representative of at least two independent experiments.

