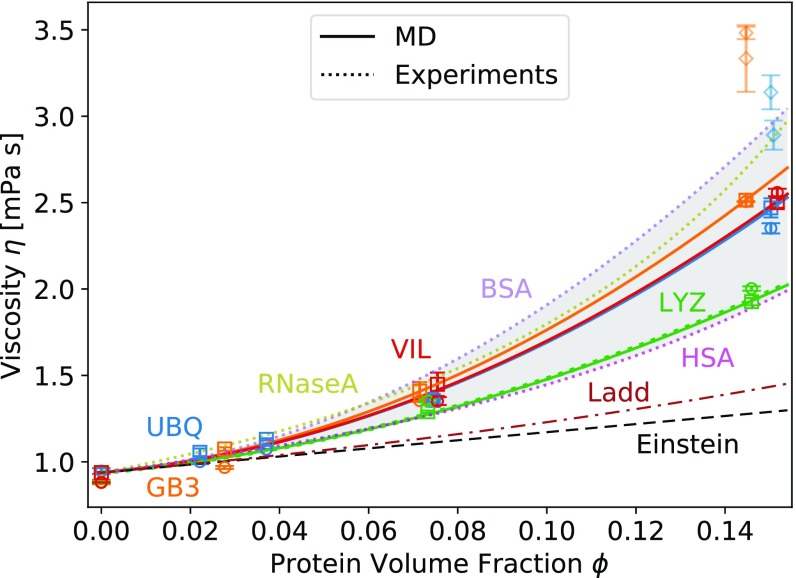
Fig. 2.
Viscosity of concentrated protein solutions as a function of protein volume fraction from all-atom MD simulations (symbols), experiments (dotted lines and gray shading), and HS colloid theory (dashed lines). Blue, UBQ; orange, GB3; green, LYZ; red, VIL. The viscosity was calculated from MD using fluctuations in the pressure tensor (SI Appendix, Eq. S3, squares; fit of Eq. 3, solid lines) and the Stokes–Einstein (SE) relations (Eq. 6; small systems , circles; large systems , diamonds). Green and purple dotted lines: fits of Eq. 3 to experimental data on concentrated LYZ (61) and BSA (62) solutions. Magenta and olive dotted lines: exponential fit [equation 4 in Zorrilla et al. (39)] to the experimental data on HSA and RNaseA solutions (39). Black dashed line: Einstein expression for HS colloidal suspensions (Eq. 4). Brown dashed-dotted line: Ladd expression (63, 64) for HSs (Eq. 5).

