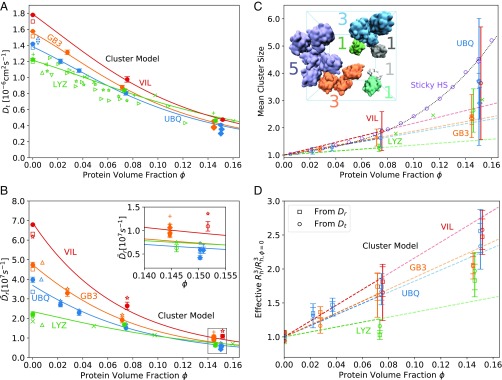
Fig. 3.
Protein diffusion and clustering. (A and B) Concentration-dependent translational (A) and rotational (B) protein diffusion. (A) Dependence of the translational diffusion coefficient on protein volume fraction . Solid circles and diamonds show the finite-size corrected diffusion coefficients of the small systems () and large systems (), respectively. Open squares show Hydropro calculations (70), and other open symbols show experimental data. UBQ data: (71), (72). LYZ data: (73), (74), (75), (21), (76), (24), (25). Lines show the predictions from the dynamic cluster model Eq. 8 with fitted . (B) Dependence of the rotational diffusion coefficients on protein volume fraction . Solid circles and diamonds show the diffusion coefficients obtained from the anisotropic diffusion tensor and corrected for finite-size effects () for the small systems () and large systems (), respectively. Stars () and plus signs () show the finite-size corrected diffusion coefficients from integration of for the small and large systems, respectively. Triangles () represent NMR data for dilute UBQ (blue) (77), dilute GB3 (orange) (78), and dilute LYZ (green) (73) solution. Green crosses () show NMR data for LYZ (25). Open squares show results from Hydropro (70) calculations. Lines show the predictions from the dynamic cluster model Eq. 9 with fitted . B, Inset shows a zoom-in at high protein volume fraction. (C and D) Protein-cluster model. (C) Dependence of mean cluster size on protein volume fraction [circles for small systems (), diamonds for large systems ()]. The dashed line shows a linear fit to the data at 0–100 mg/mL with binding propensity listed in Table 1. Purple circles and diamonds are results from a Monte Carlo simulation of Baxter’s sticky HSs with and particles in the box, respectively, using and finite-range attractive interactions up to 1.05 . The dotted curve shows the fit to the MC data up to . Green crosses show experimental data on LYZ cluster formation (79). (C, Inset) Representative simulation snapshot of dense UBQ solution (100 mg/mL). Blue lines indicate the periodically replicated simulation boxes. Colors and colored labels indicate transient UBQ protein clusters and cluster size , respectively (solvent not shown). (D) Dependence of reduced hydrodynamic radii cubed, , on protein volume fraction . The effective is calculated from the Stokes–Einstein relations for translation, Eq. 10 (circles), and for rotation, Eq. 11 (squares). The dashed lines show the prediction from C with values from Table 1.

