
Figure 1.
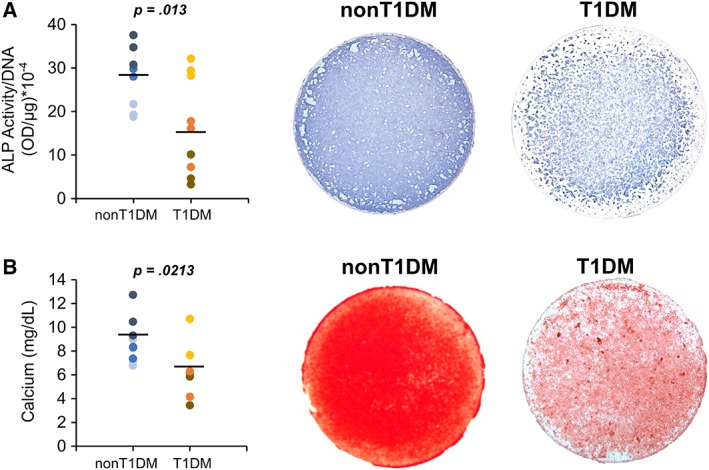
Osteogenic differentiation of bone marrow‐derived mesenchymal stem cells (BMSCs) harvested from type 1 diabetes mellitus (T1DM) and non‐T1DM donors. (A): Quantification and cytological staining of alkaline phosphatase activity of the cell after osteogenic induction. (B): Quantification of calcium content and cytological staining of alizarin red to detect matrix mineralization in BMSC culture induced for osteogenesis. n = 3 biological replicates. Each color of dots represents one donor.