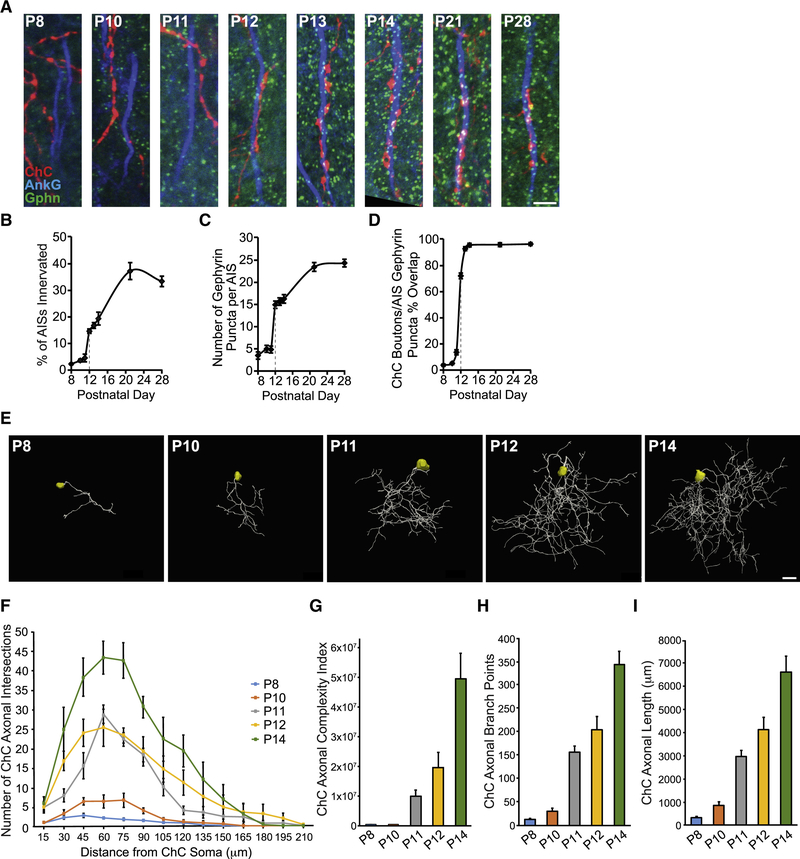
Figure 4. Developmental Profiling of ChC Axonal Morphology and Connectivity.
(A) Temporal profile of PyN AIS innervation by ChCs in LII of somatosensory cortex from Nkx2.1-CreER;Ai9 mice. Representative images of RFP+ ChC cartridges, AISs of neighboring PyNs, and gephyrin puncta at time points spanning P8 to P28. Scale bar, 5 μm.
(B-D) Quantification of the percentage of PyN AISs innervated by single RFP+ ChCs (B), the average number of gephyrin puncta per PyN AIS (C), and the percentage of RFP+ ChC boutons overlapping with AIS gephyrin puncta (D) from P8 to P28. 5–9 ChCs and 177–321 GFP+ PyNs (B) or 8–25 PyN AISs (C, D) per ChC from 3 animals were analyzed for each time point.
(E) Representative maximum projection renderings from 3D reconstructions of individual neocortical RFP+ ChC somas and axons at time points spanning P8 to P14. Scale bar, 20 μm.
(F) Scholl analysis comparing axonal arbors of ChCs at time points spanning P8 to P14. 4–7 ChCs from 3 animals were analyzed for each time point.
(G-I) Morphometric analyses of ChC axonal complexity index (G), branch points (H), and length (I) at time points spanning P8 to P14. 4–7 ChCs from 3 animals were analyzed for each time point.
Data are mean ± SEM.

