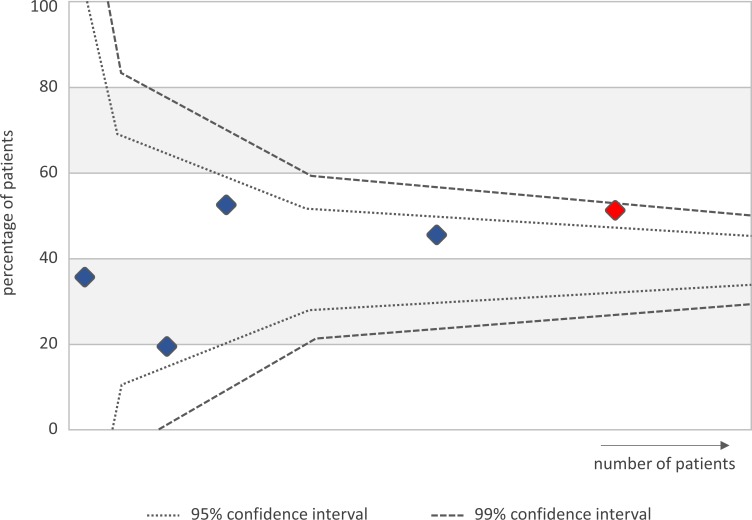
Figure 3.
Example of graph of aggregated data on clinical indicators for quality improvement in SpA-Net, care provider’s perspective. In order to stimulate performance evaluation and benchmarking, aggregated data on relevant clinical indicators of care are presented in a separate dashboard in SpA-Net. For illustrative purposes, an example is shown presenting the proportion of patients with an ASDAS <2.1 For the care provider’s centre (red dot) in comparison with other participating centres (blue dots). ASDAS, Ankylosing Spondylitis Disease Activity Score.

