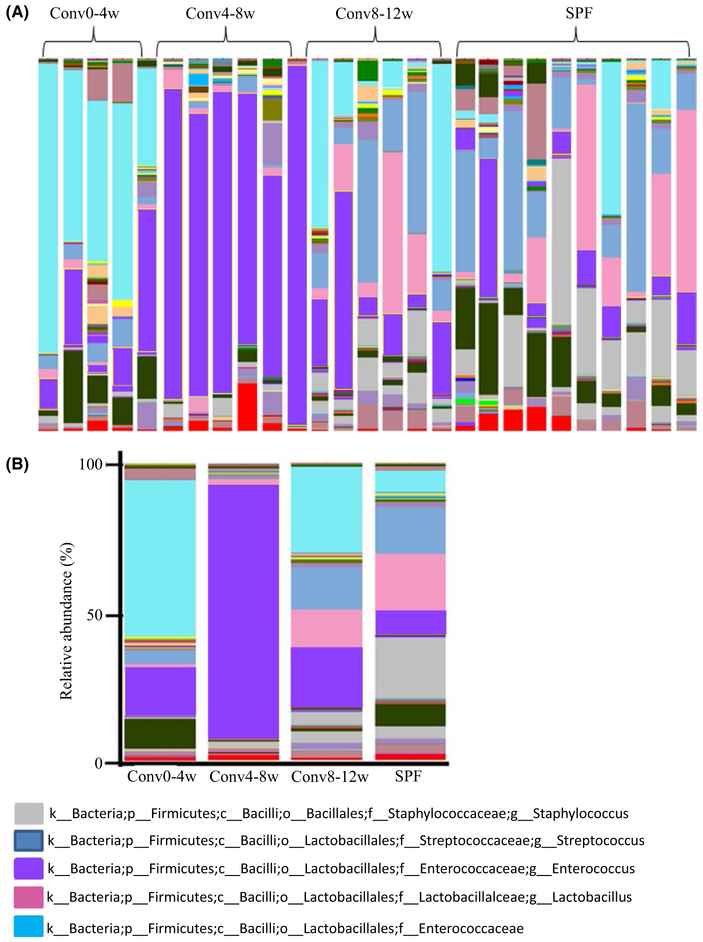
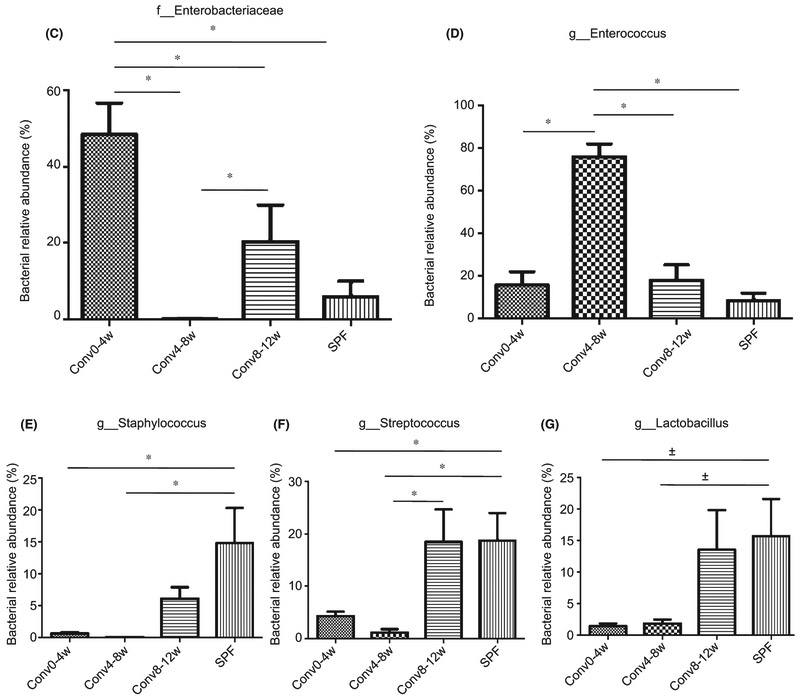
FIGURE 3.
Recipient mouse age influences oral microbial composition during conventionalization of germ-free mice. (A) Area charts show the relative abundance of the predominant bacteria in each group. (B) The relative abundance ratio of the top five bacteria observed in different groups. (C-G) Relative abundance of Enterobacteriaceae, Enterococcus, Staphylococcus, Streptococcus and Lactobacillus, respectively. *Significant difference (P<.05) between the indicated groups, ± indicates the difference between the indicated groups is P=0.06.


