
Fig. 3. DLL3 detection in CTCs.
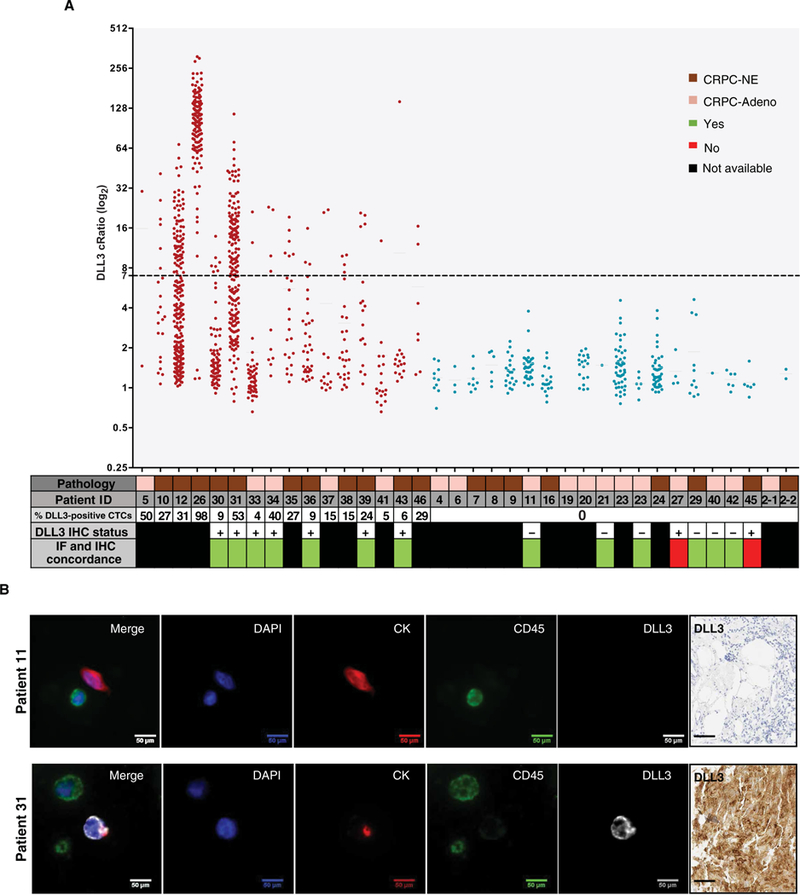
(A) Graph showing DLL3 positivity in CTCs of 36 patients with CRPC-Adeno and CRPC-NE tested with the DLL3 Epic four-color immunofluorescence (IF) assay. DLL3 cRatio (signal-to-noise ratio) is plotted along the y axis, and patient ID is plotted along the x axis. The x axis also includes a data table with additional patient-specific information including pathology [CRPC-NE (brown) or CRPC-Adeno (light brown)], percentage of DLL3-positive CTCs, DLL3 IHC status, and IF and IHC concordance. Samples expressing DLL3 are indicated in red, and samples negative for DLL3 are indicated in blue. Each dot represents a detected cell, and the dashed line at 7 along the y axis indicates the analytical threshold of positivity for DLL3. (B) Representative images of patient 11 (DLL3-negative) and patient 31 (DLL3-positive) CTCs. In the four-color composite image, blue represents 4′,6-diamidino-2-phenylindole (DAPI), and red is used for CK, green for CD45, and white for DLL3. Other images show the independent images for each channel used to create the four-color composite (DAPI, CK, CD45, and DLL3). Scale bars, 50 μm. Corresponding DLL3 IHC image is also included for both patients. Scale bars, 50 μm.