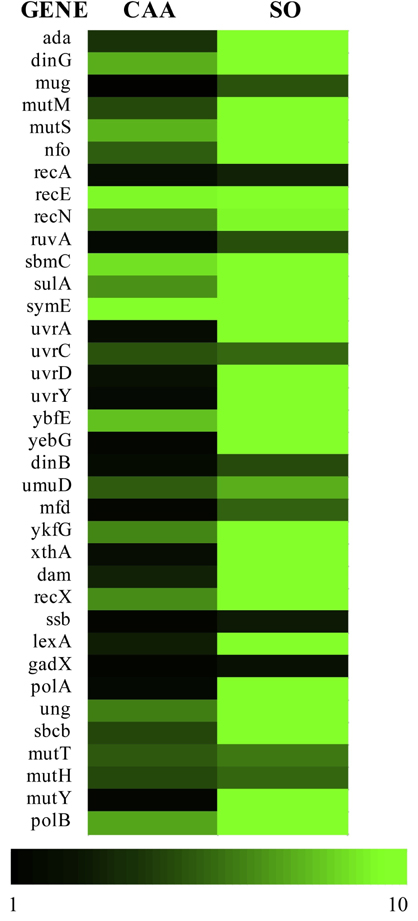
Figure 2.
TELI fluorescence heat map of DNA damage and DNA stress response genes from E. coli MG1655 exposed to CAA (0.5 mg/mL in H2O) and SO (1.4 mg/mL in DMSO). The TELI values range from 1 (black = promoter of gene not upregulated and GFP not produced) to 10 (bright green = promoter of gene upregulated and GFP produced), as indicated.

