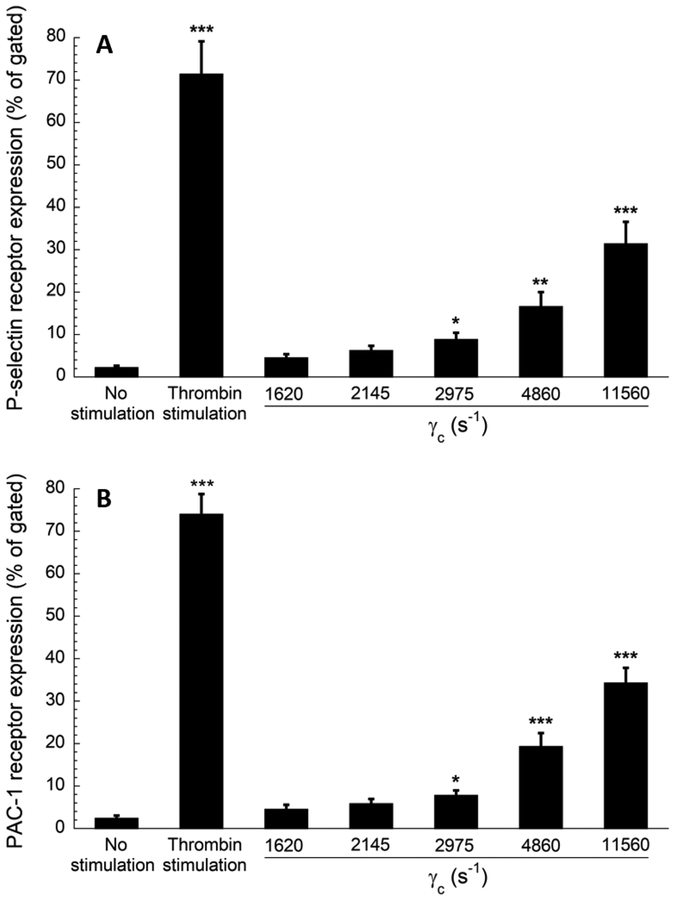
Figure 5.
Flow cytometry results of platelet activation. Expression levels of (A) P-selectin and (B) activated GPIIb/IIIa (PAC−1 receptor) in perfused blood samples were compared with unstimulated (negative control) and thrombin stimulated (positive control) blood samples collected prior to perfusion. Analysis of 100,000 events for each sample was conducted, and events of platelets expressing each marker were recorded. Statistical significance was obtained using a paired t-test (n = 4, *p < 0.05, **p < 0.005 and ***p < 0.0005 relative to “no stimulation” control).

