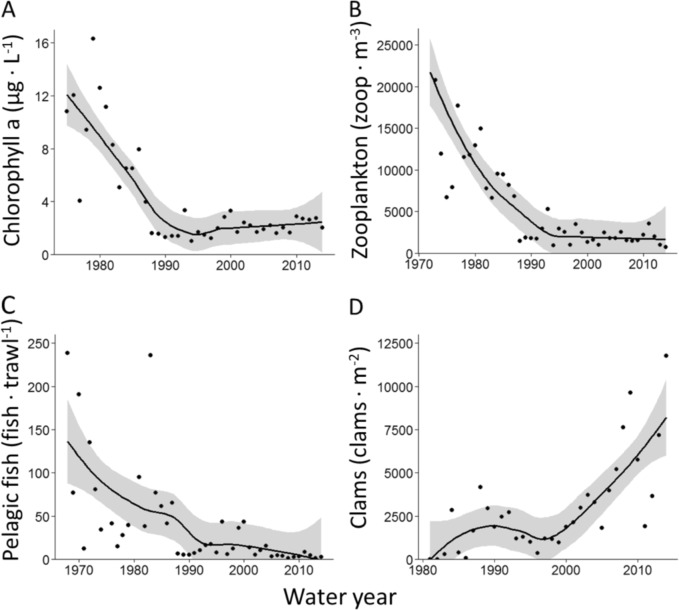
Fig. 3.
Loess curves fit to water year means of chlorophyll a (panel a), mesozooplankton (panel b), and pelagic fish (panel c) averaged across three stations in the San Francisco Estuary (D10, D8, and D7, or nearby these stations; Table S6). The clam data (panel d) are from D7 only (the other stations are not monitored for benthic invertebrates). Note that mesozooplankton, fish, and clams are summed across taxa (although ‘clams’ is 96.4% P. amurensis), and that the x-axis scales vary

