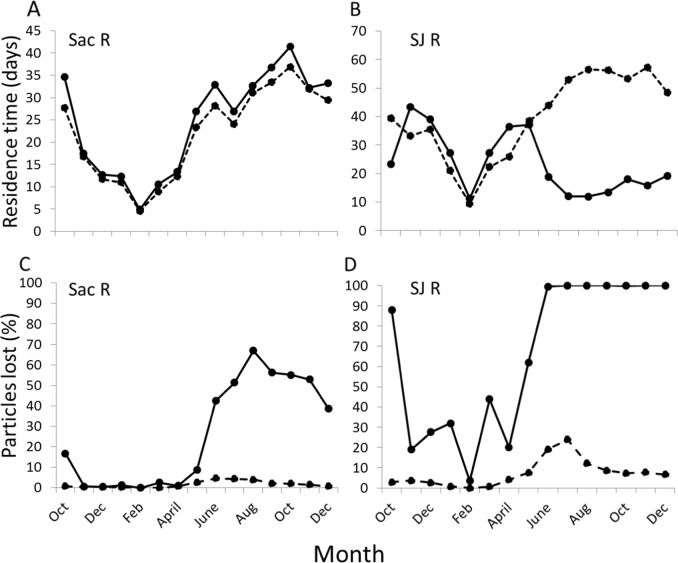
Fig. 4.
Residence time (a and b) and particles lost (%; c and d) with and without observed levels of CVP and SWP pumping for the Sacramento River (a and c) and Joaquin River (b and d). Solid lines are ‘CVP and SWP pumping’ and dashed lines are ‘no CVP and SWP pumping’. The plot includes water year 1999 through the first three months of water year 2000 (a period of near average flow)

