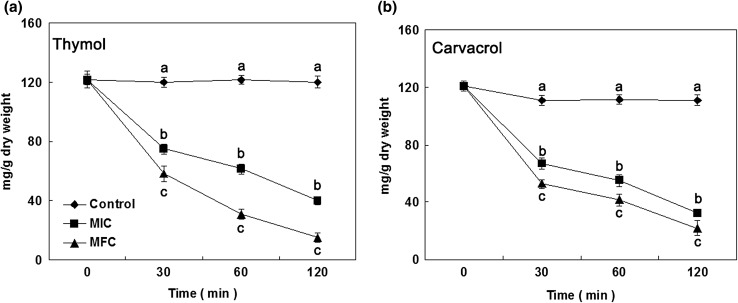
Fig. 5.
Total lipid content of B. cinerea cells in the presence of thymol (a) and carvacrol (b) [(diamond): control; (square): MIC; (circle): MFC]. Data presented are the means of pooled data. Error bars indicate the SDs of the means (n = 3). Means with different letters in the same column were significantly different at the level of p < 0.05

