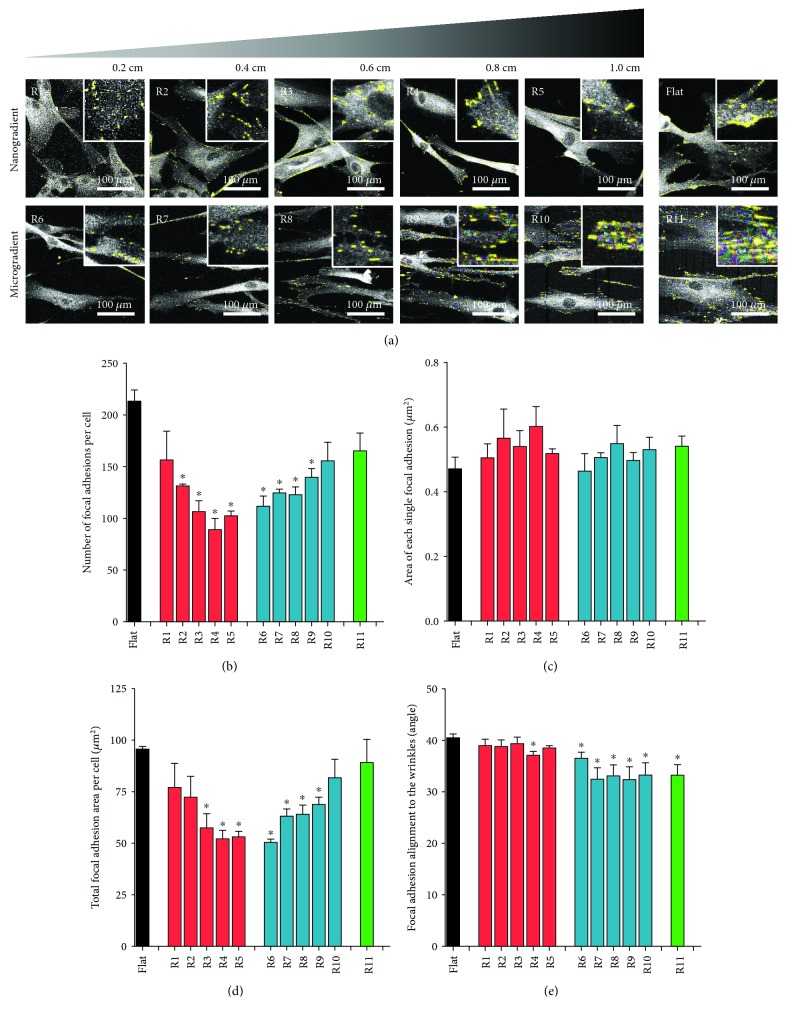
Figure 4.
Focal adhesions (24 h of culture). (a) Fluorescence staining for vinculin (white) on the different wrinkle sizes of nano- (R1-R5) and microtopography (R6-R11) gradients, as well as on the flat PDMS control. Yellow dots represent the areas recognized as focal adhesions by the Focal Adhesion Analyze Server. (b) Number of focal adhesions per cell. (c) Area of each single focal adhesion. (d) Total focal adhesion area per cell. (e) Focal adhesion alignment to the directional topography. For all the graphs, black represents the flat PDMS control, red represents the nanotopography gradient, blue represents the microtopography gradient, and green represents R11; ∗ p < 0.05 vs. PDMS flat control. Values represent mean ± SEM of 3 independent experiments.

