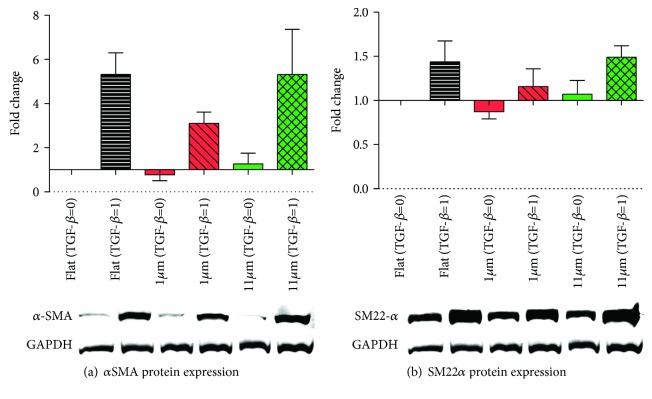
Figure 7.
Protein expression of myogenic markers (7 days of culture). (a) Relative protein expression of αSMA with and without TGF-β1 induction in flat and uniform wrinkle (1 μm and 11 μm) topographies. Representative WB results are shown below the graph. (b) Relative protein expression of SM22α with and without TGF-β1 induction in flat and uniform wrinkle (1 μm and 11 μm) topographies. Representative WB results are shown below the graph. For all the graphs, black represents the flat PDMS control, red represents the 1 μm uniform features, and green represents the 11 μm uniform features. Values represent mean ± SEM of 3 independent experiments. Statistical analysis was performed comparing the flat topography to both of the linear topography patterns for both TGF-β1-stimulated and not stimulated groups.

