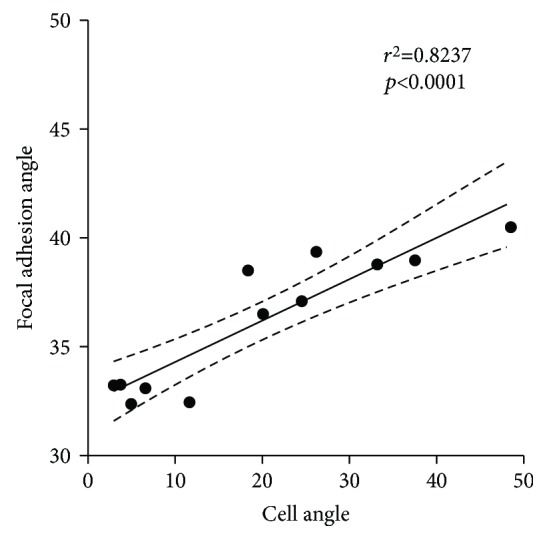
Figure 8.

Scatter plot showing the correlation between cell and focal adhesion alignment. Pearson correlation, r 2 = 0.8237, p < 0.0001. Values represent the mean of 3 independent experiments. Data from the experiment using all 11 topographical ranges in which cells were cultured for 24 hours without TGF-β1.
