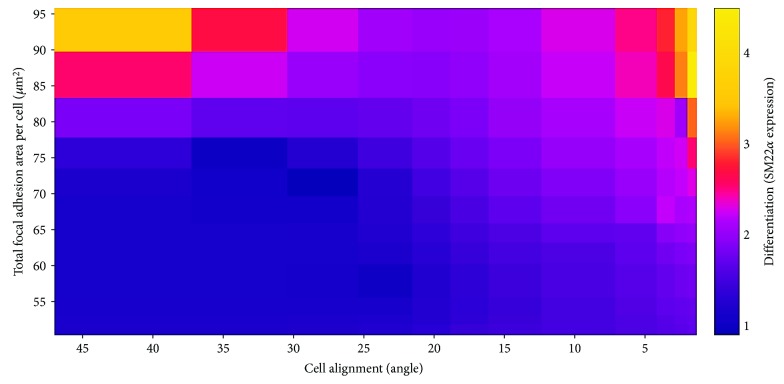
Figure 9.
Heat map interpolating focal adhesion area per cell, cell alignment, and expression of SM22α data. Data for focal adhesions and cell alignment were from the experiment using all 11 topographical ranges in which cells were cultured for 24 hours without TGF-β1. Data for differentiation were from the experiment in which cells were cultured for 7 days under stimulation with TGF-β1, also with all 11 topographical ranges.

