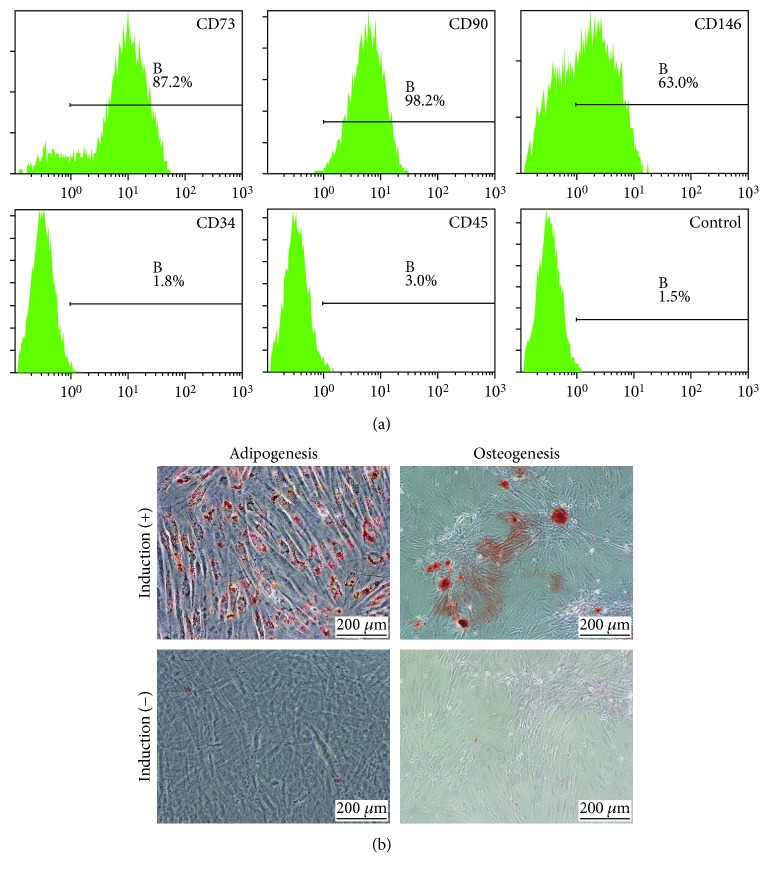
Figure 1.
Characterization of GMSCs. (a) Flow cytometric analysis of surface markers of GMSCs. GMSCs were positive for MSC markers including CD73 (87.2%), CD90 (98.2%), and CD146 (63%) and were negative for hematopoietic stem cell markers, CD34 (1.8%) and CD45 (3.0%). (b) Representative images of adipogenic differentiation and osteogenic differentiation. The visual field was filled with red lipid droplets stained with Oil Red O solution in images of adipogenic differentiation. Calcium nodules with burrs were formed in images of osteogenic differentiation, which were stained red by Alizarin Red solution.

