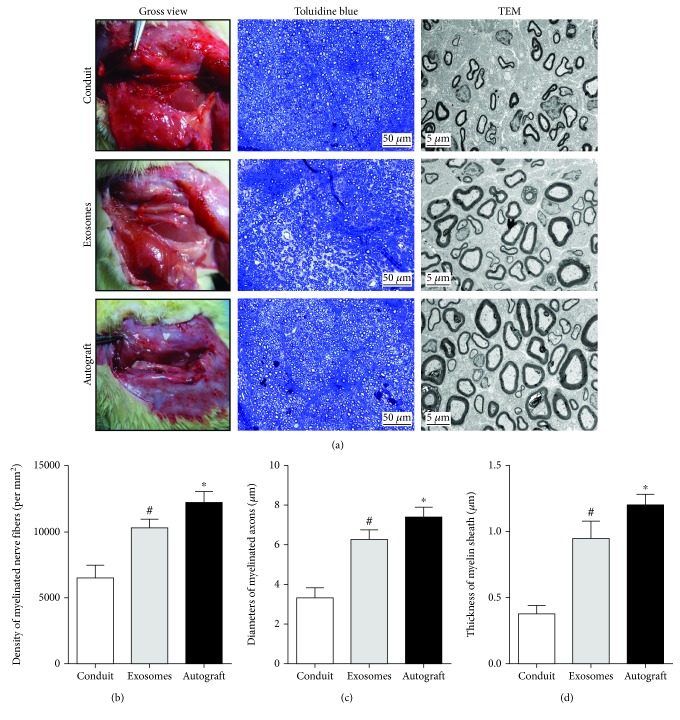
Figure 5.
Evaluation of regenerated nerve fibers at 12 weeks after surgery. (a) Gross view, toluidine blue-stained transverse sections, and TEM images of the regenerated sciatic nerve. (b) Density of myelinated axons. (c) Diameters of myelinated axons. (d) Thickness of myelin sheath. Data are expressed as means ± SEM (n = 8). Statistical significance was obtained with one-way ANOVA with Tukey's post hoc test. ∗p < 0.05, #p < 0.01.

