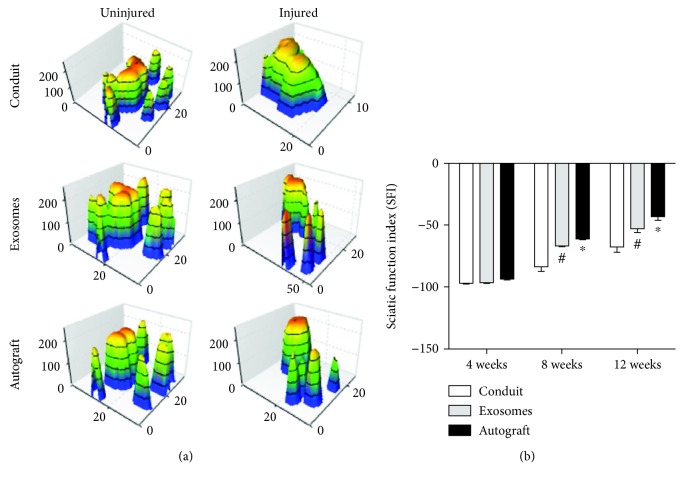
Figure 8.
Motor functional recovery at 12 weeks by CatWalk gait analysis. (a) Representative 3D plantar pressure distribution of RH (injured) and LH (uninjured) of each group (by statistical analysis of SFI values). Data are expressed as means ± SEM (n = 8). Statistical significance was obtained with one-way ANOVA with Tukey's post hoc test. ∗p < 0.05, #p < 0.01.

