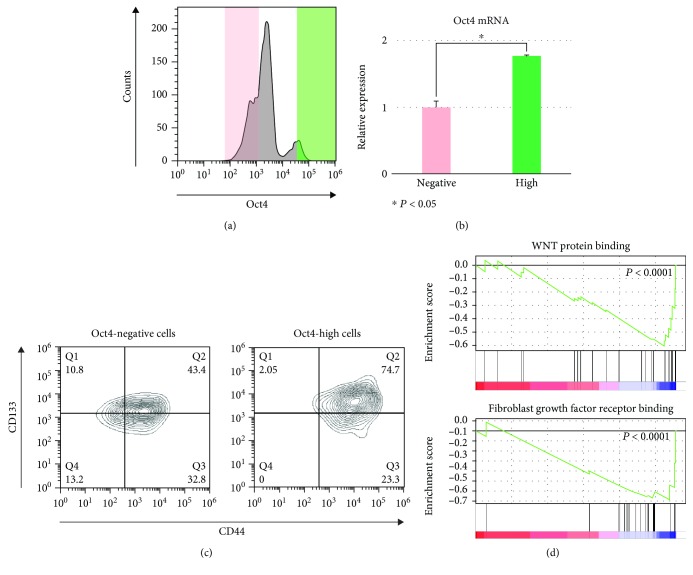
Figure 2.
Analysis of Oct4-EGFP-positive cells. (a) Representative FACS of enriched Oct4-EGFP cells by sorting. Oct4-positive cells and Oct4-negative cells were shown. Oct4-high cells (green area) and Oct4-negative cells (pink area) were analyzed. (b) Oct4 mRNA expression of Oct4-high cells (green area of (a)) was high compared with that of Oct4-negative cells (pink area of (a); n = 3, P < 0.05). (c) Expressions of CD44 and CD133 were high in Oct4-high cells (green area of (a)) compared with Oct4-negative cells (pink area of (a)). (d) Gene set enrichment analysis (GSEA) of Oct4-high cells (green area of (a)) and Oct4-negative cells (pink area of (a)). Representative GSEA was shown, and genes relating to WNT protein binding (P < 0.001) and fibroblast growth factor receptor binding (P < 0.001) were enriched in Oct4-high cells.

