Figure 1.
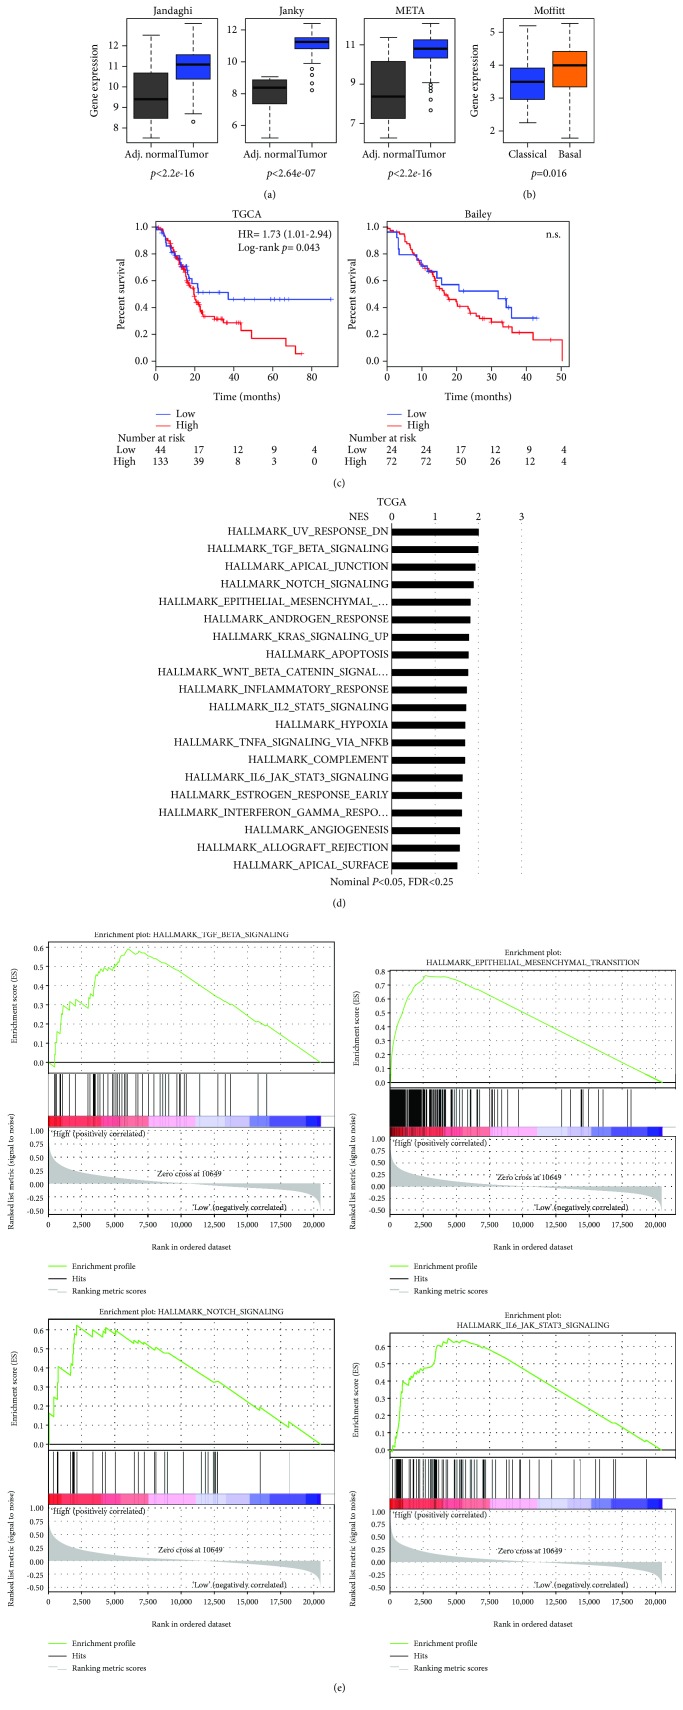
ANTXR1/TEM8 is overexpressed in PDAC. (a) Boxplots showing the differential expression of ANTXR1 in PDAC samples versus normal adjacent tissue in three independent series of transcriptomics data (Jandaghi: n = 13 adj. normal, n = 118 tumor; Janky: n = 70 adj. normal, n = 108 tumor; META: n = 13 adj. normal, n = 118 tumor). (b) Boxplots showing the differential expression of ANTXR1 in classical versus basal tumors from the Moffitt series (n = 89 classical, n = 36 basal). (c) Kaplan-Meier curves showing the overall survival of PDAC patients, stratified based on high and low ANTRX1 expression using the optimal cutoff calculated through http://www.kmplot.com for the TCGA and Bailey et al. datasets. The hazard ratio (HR) and number of patients at risk are shown. (d, e) Gene sets enriched in the transcriptional profiles of tumors belonging to the top ANTXR1 high-expression group, compared with the bottom-expression group in the TCGA dataset. A nominal p value of <0.05, FDR < 25% is considered statistically significant. Shown are the NES (normalized enrichment score) values for each pathway using the Hallmark gene sets (d) and example enrichment plots for TGF-beta, EMT, NOTCH, and IL-6/JAK6/STAT3 signaling (e).

