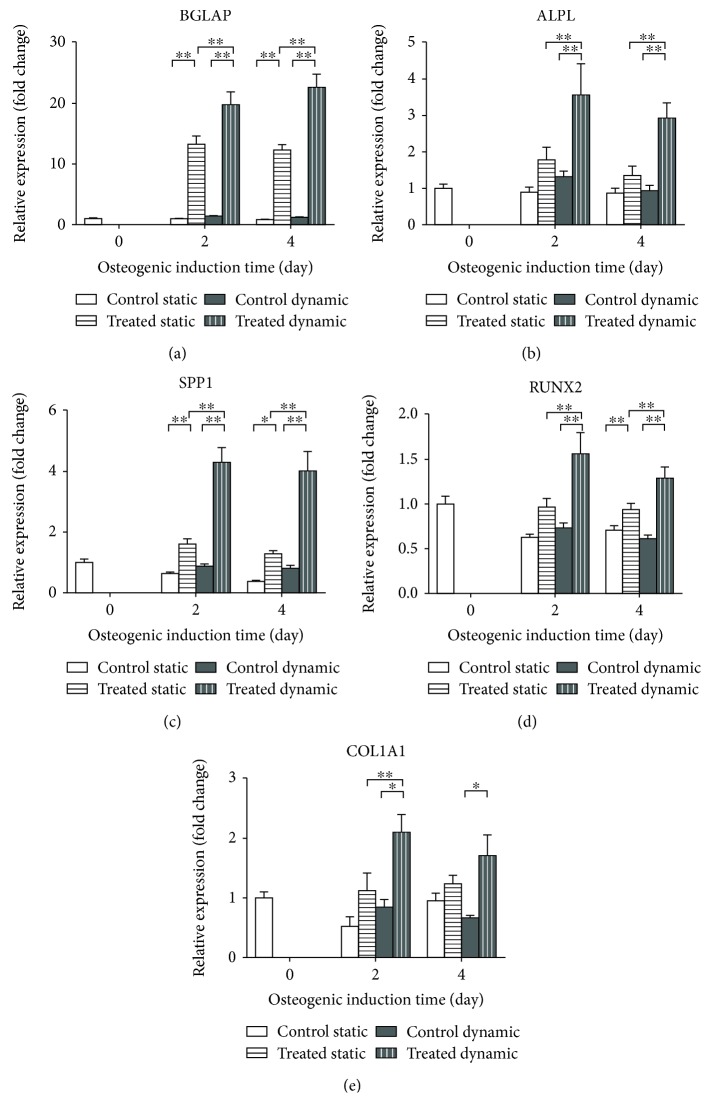
Figure 6.
Effect of osteogenic induction on gene expression comparing standard static and dynamic cell culture conditions. qPCR analysis of osteogenic markers (BGLAP, ALPL, SPP1, RUNX2, and COL1A1) was performed on L88/5 cells stimulated with the osteogenic cocktail (20 nM 1α,25-dihydroxyvitamin D3, 50 μM L-ascorbic acid 2-phosphate, and 10 mM β-glycerophosphate) for 2 and 4 days under static and dynamic cell culture conditions. B2M and GAPDH were used as reference genes (2-ΔΔCT method). Fold changes from control untreated cells at day 0 were calculated. All data are reported as mean±SEM of three biological replicates. ∗p < 0.05 and ∗∗p < 0.01.

