Figure 3.

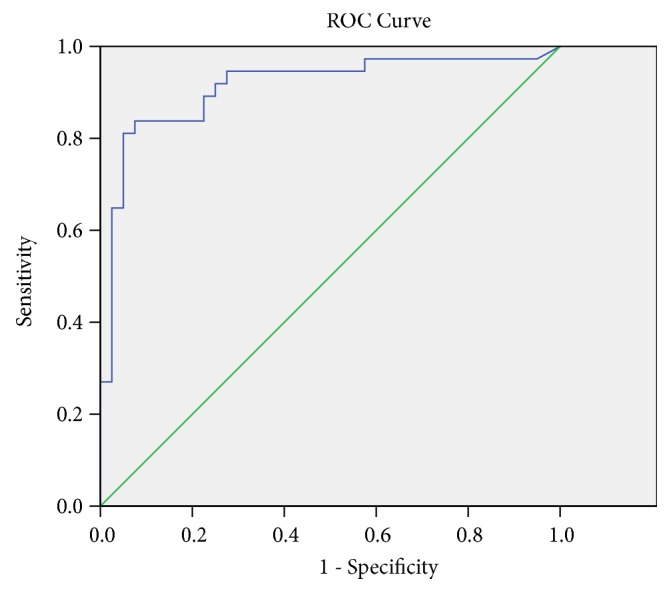
ROC curve analysis of EBV-DNA levels for distinguishing between NPC patients and controls. The area under the ROC curve is 0.912 (p≤0.001).

ROC curve analysis of EBV-DNA levels for distinguishing between NPC patients and controls. The area under the ROC curve is 0.912 (p≤0.001).