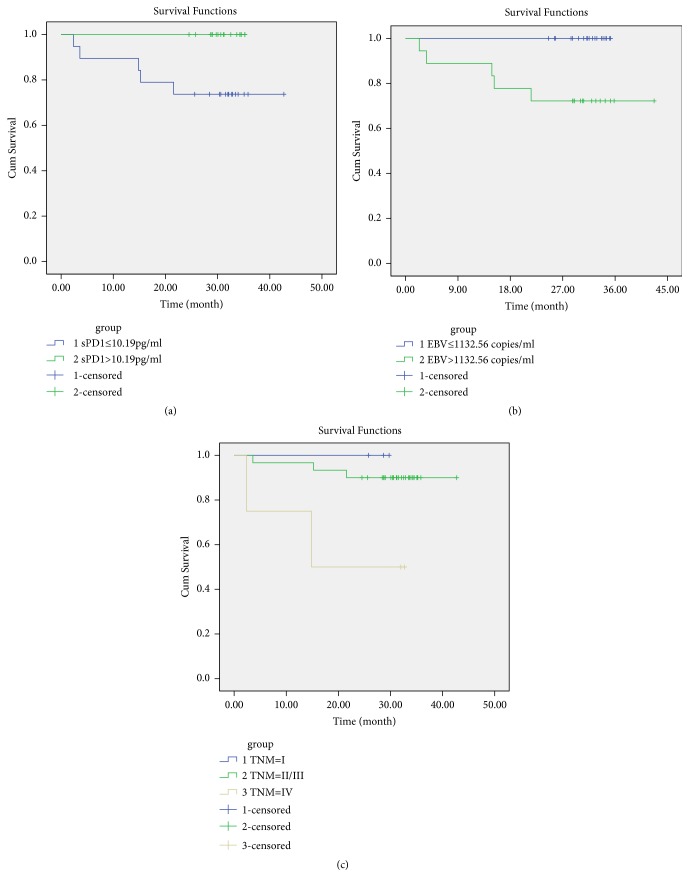
Figure 4.
Kaplan-Meier survival analysis of NPC patients. (a) Comparison of the OS between patients with sPD-1 concentrations above and below the median (10.19 pg/ml, p=0.021). (b) Comparison of the OS between the patients with EBV-DNA levels above and below the median (1132.56 copies/ml, p=0.015). (c) Comparison of the OS between TNM I, II+III, and IV patients (p=0.026). Early stage, I; middle stage, II+III; late stage, IV.

