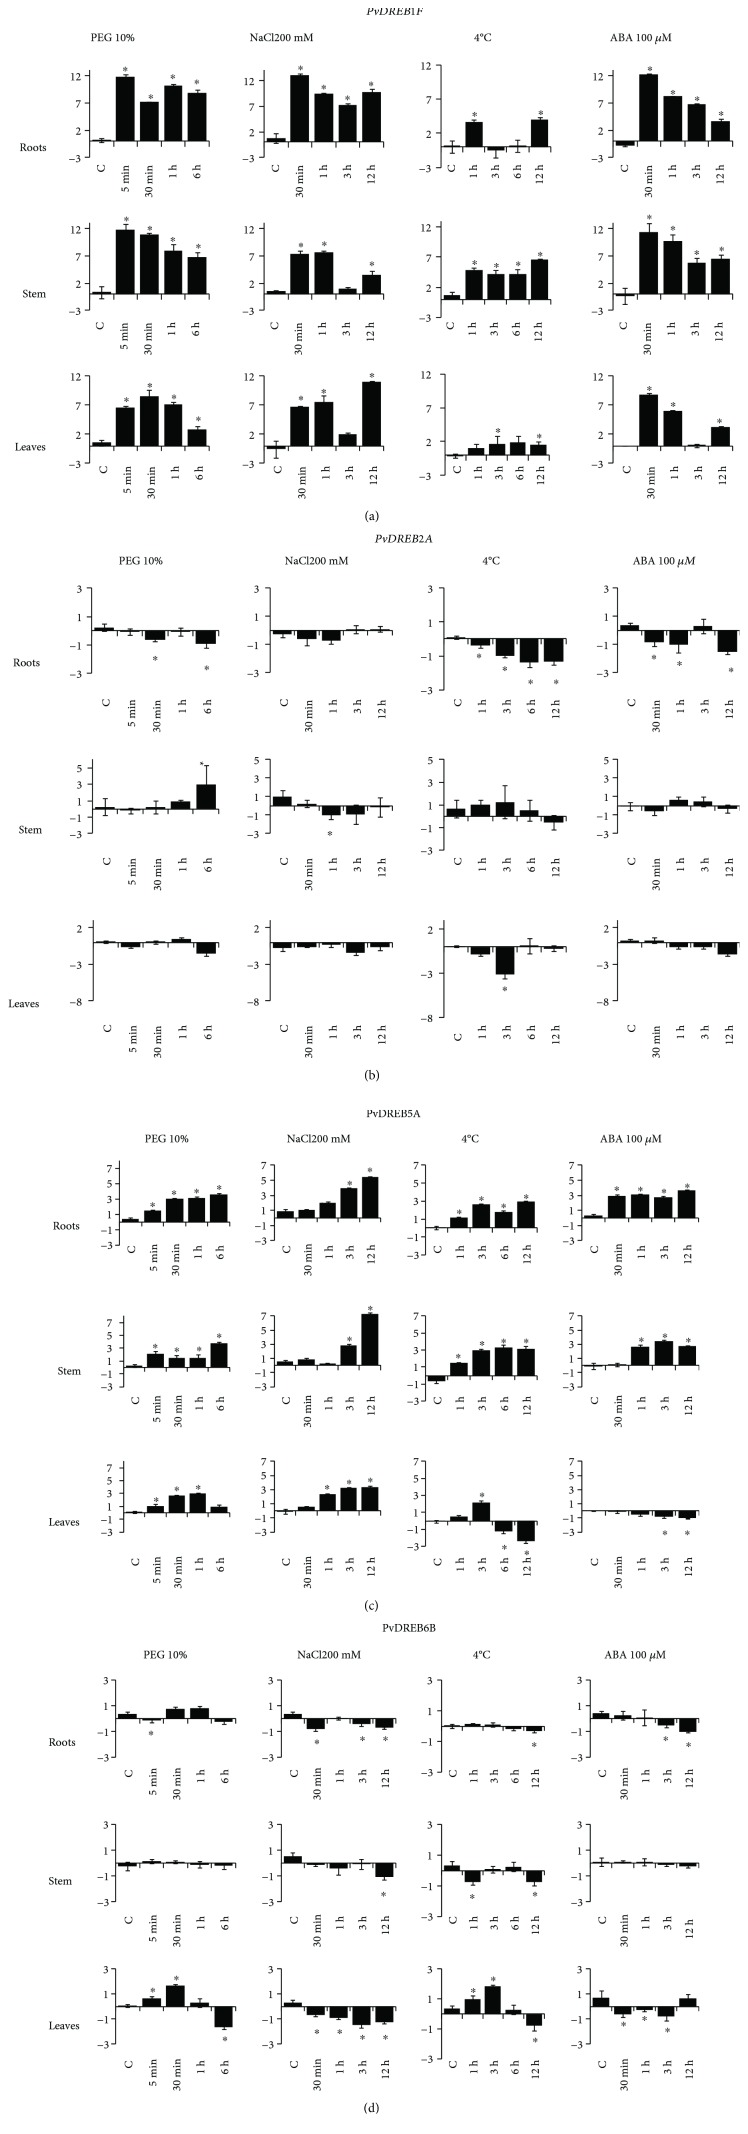
Figure 9.
Temporal and spatial scale qRT-PCR gene expression profile of four common bean DREB genes: a- PvDREB1F, b- PvDREB2A, c- PvDREB5A, and d- PvDREB6B, in BAT 477 (drought-tolerant genotype) plants subjected to different abiotic stress induction: dehydration by using polyethylene glycol (PEG 10%), high salinity by a solution of NaCl 200 mM, cold by incubation at 4°C, and abscisic acid induction factor (ABA 100 μM solution). Values are expressed in relative terms: expression value of stressed samples is relative to control samples. ∗ indicates significant up or downregulation of the genes in comparison to their control samples.

