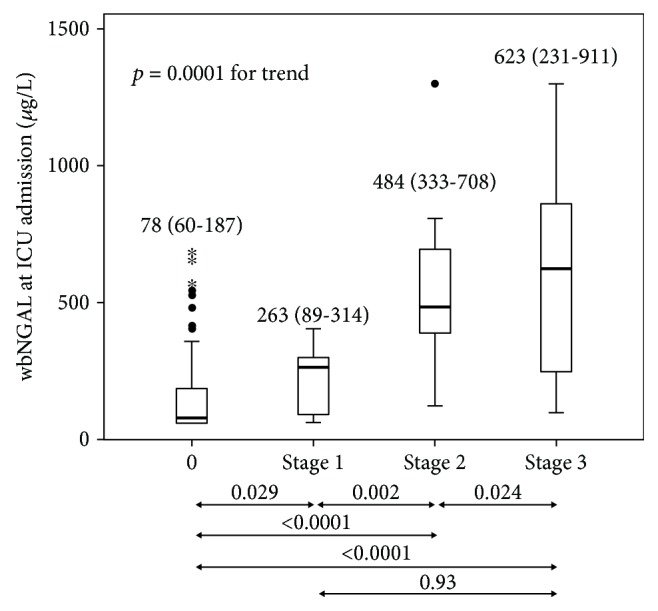
Figure 2.

Boxplot comparing whole-blood NGAL (wbNGAL) concentrations (μg/L) and KDIGO score at admission. Boxplots indicate the median and 25th and 75th percentiles. Whiskers indicate the 5th and 95th percentiles. Statistical significance (p) comparing wbNGAL (μg/L) with KDIGO categories is given at the bottom of the figure.
