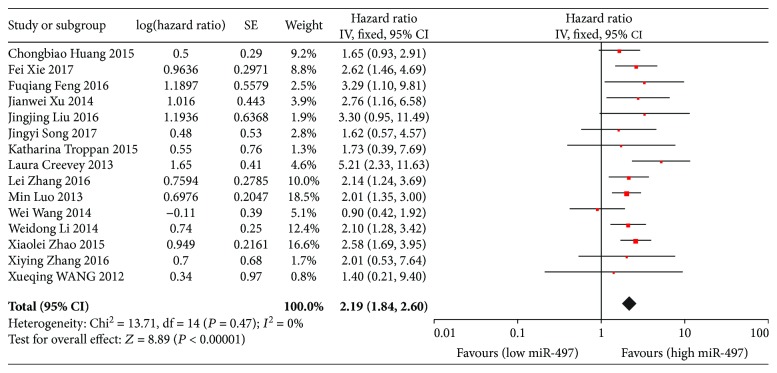
Figure 2.
Forest plots of the relationship between the miR-497 expression level and OS. The squares and horizontal lines represent the HR and 95% CI, respectively. The area of the squares reflects the weight of each study. The diamond represents the pooled HR and 95% CI. OS: overall survival; CI: confidence interval; SE: standard error; df: degrees of freedom; miR: microRNA.

