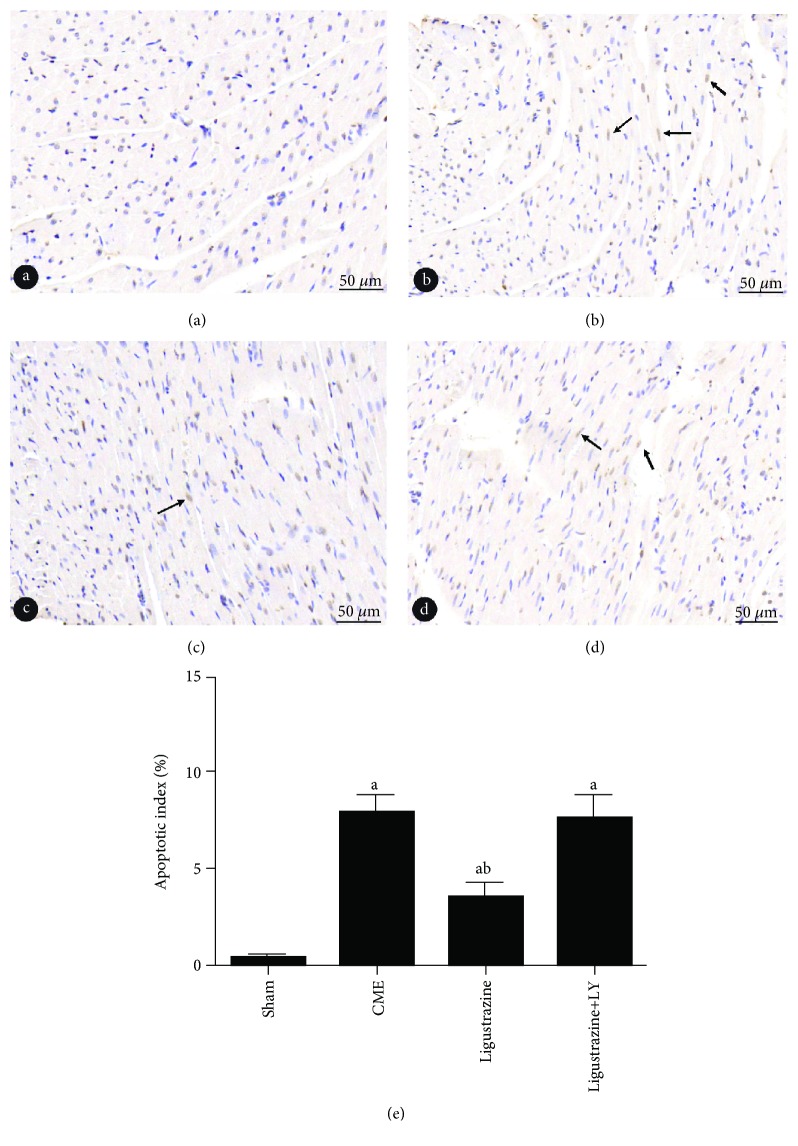
Figure 6.
Cardiomyocyte apoptosis is showed with TUNEL staining (magnification, ×400; bar = 50 μm). (a–d) Sham group, CME group, ligustrazine group, and ligustrazine+LY group. Nuclei of apoptotic in yellow while the normal cardiomyocytes in light blue. Arrow indicates nuclei of apoptotic cardiomyocytes. LY: LY294002; CME: coronary microembolization. aP < 0.05 compared to the sham group. bP < 0.05 compared to the CME group. n = 10.

