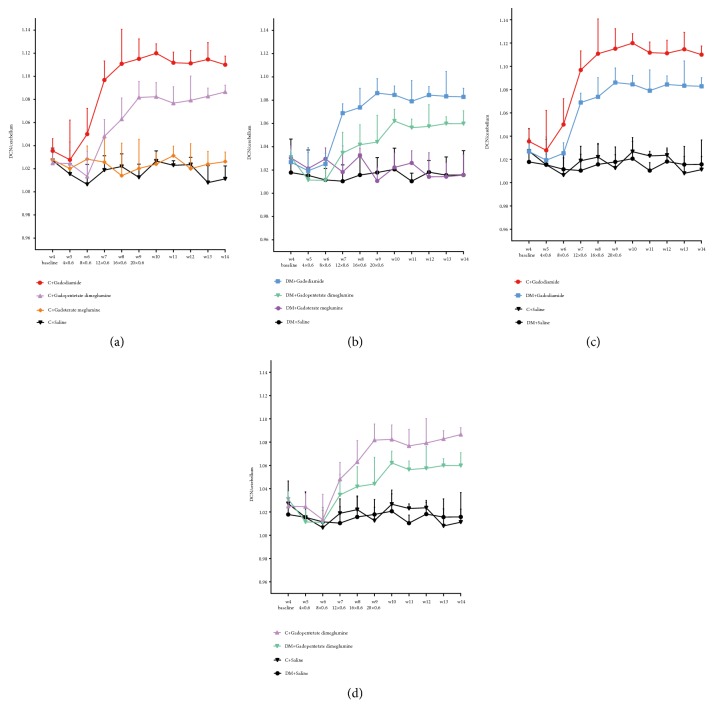
Figure 2.
Quantitative analysis of the T1-weighted DCN to cerebellum signal ratio on weekly MR sequences. (a) Normal rats with different GBCAs. (b) Diabetic rats with different GBCAs. (c) Rats with linear gadodiamide. (d) Rats with linear gadopentetate dimeglumine. The error bars represent the SD of the DCN to cerebellum signal ratio. C = normal rats; DM = diabetic rats.

