Figure 4.
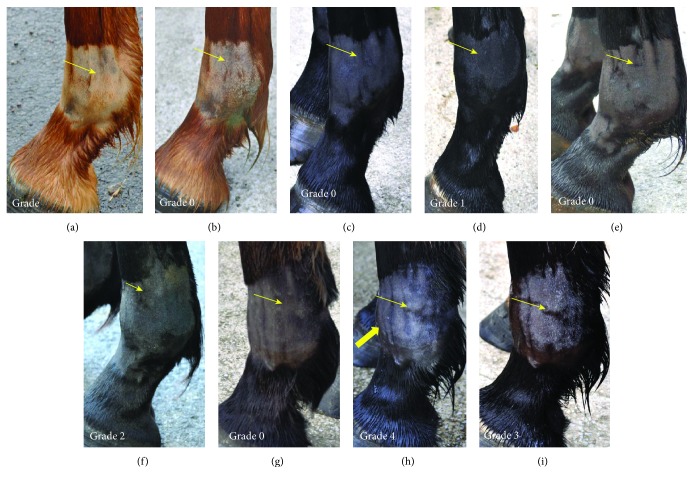
Photographs of the lateral aspect of the fetlock joint of 4 horses taken on day 0 (D0) before MSC injections (a, c, e, g), on day 1 (D1) after injection (b, d, f, h), and on day 7 (D7) after injection (i) showing the different grades of joint effusion observed. See the proximopalmar recess of the metacarpophalangeal joint (light arrow) and the distention of the dorsal recess of the joint (thick arrow). (a, b) Left front fetlock of horse 1 injected with allogeneic BM-MSCs showing grade 0 fetlock joint effusion on D0 and D1. (c, d) Left front fetlock of horse 3 injected with autologous BM-MSCs showing grade 0 fetlock joint effusion on D0 (c) and grade 1 on D1 (d). (e, f) Right front fetlock of horse 6 injected with allogeneic UCB-MSCs showing grade 0 fetlock joint effusion on D0 (e) and grade 2 on D1 (f). (g, h, i) Left front fetlock of horse 7 injected with allogeneic BM-MSCs showing grade 0 fetlock joint effusion on D0 (g), grade 4 on D1 (h), and grade 3 on D7.

