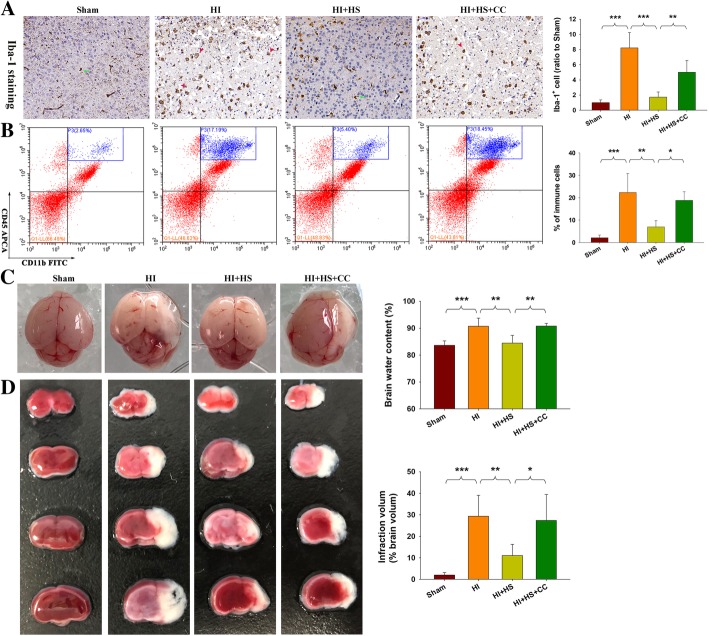
Fig. 2.
Effects of HS on HI-induced microglial activation. a Representative Iba-1 staining within the core of infarcted cortex at 3 days following HI insult. N = 4/group. b Representative flow cytometric lots of CD11b+/CD45high cells within ipsilateral cortex at 3 days following HI insult. N = 4/group. Right histograms of average percentage of CNS-associated phagocytes (CD11b+/CD45high cells) in live single immune cells from brains. c Representative brain images as obtained at 72 h following HI. Arrows indicate sites of significant edema. Brain water content was determined at 72 h following HI insult, N = 6/group. d Representative samples stained with TTC. Quantified infarct volume is indicated by the white area. N = 6/group. Values represent the mean ± SD, *p < 0.05, **p < 0.01, ***p < 0.001 according to ANOVA

