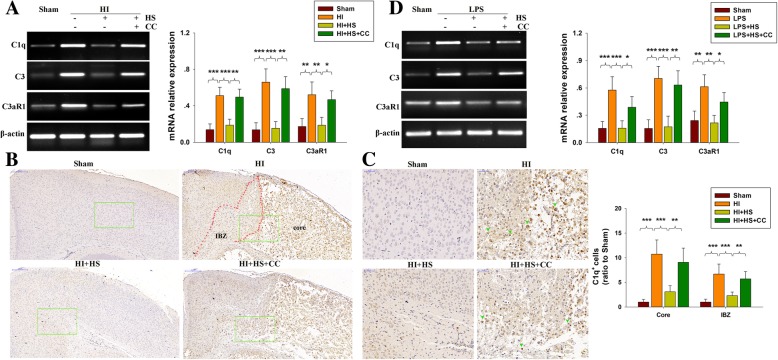
Fig. 6.
HS suppresses HI-induced complement activation in the lesioned cortex. a Representative RT-PCR photographs showing mRNA levels of C1q, C3 and C3aR1 within ipsilateral cortex at 3 days post-HI. Quantitative results of relative mRNA levels within each group. Values were normalized to β-actin. N = 4 mice/group. b Representative photographs of C1q staining within ipsilateral cortex taken at 72 h following HI. c Magnified views of boxed regions in B showing C1q staining. Quantification of C1q+ cells. N = 6/group. d BV-2 cells treated with 1 μM HS with/without 500 ng/mL LPS or 1 μM Compound C for 2 h. The mRNA levels of C1q, C3 and C3aR1 were determined with use of RT-PCR. Values represent the mean ± SD, *p < 0.05, **p < 0.01, ***p < 0.001 according to ANOVA

